MDA Analyzer requires two files to function:
1.
A Thermo mass spectrometer RAW files.
2.
A Search Engine Processor
(DOI:10.1002/pmic.201100529) SEPro files. A *.sepr file is provided by
PatternLab´s Search Engine Processor module, which applies a series of
statistical filters to results provided by SEQUEST, ProLuCID, or preferably, COMET
which is integrated into PatternLab.
3.
Example dataset can be downloaded here.
HOW TO USE
1.
INSTALLING MDA ANALYZER
The latest version of the MDA Analyzer software is available here. The software requires version 4.7.2 or up of the .NET framework.
2.
EXTRACT MS2 DDA SPECTRUM
2.1.
Click on “Tools” (Figure 1).
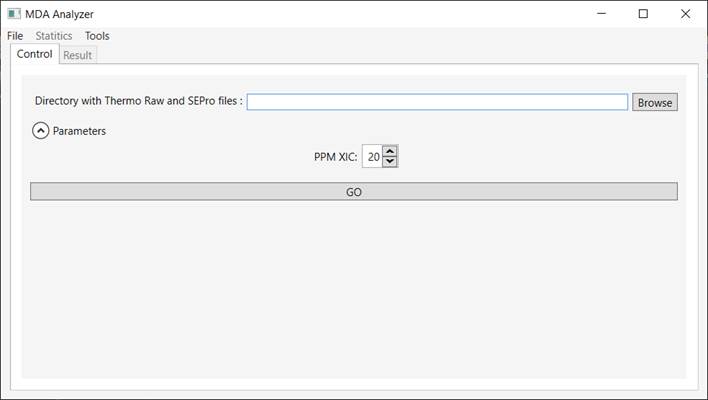
Figure 1 - Graphical user
interface of the Mix-Data-Acquisition software.
2.2.
Indicate a directory containing Thermo RAW files, select “MS2 DDA” and then click on “GO” (Figure 2).
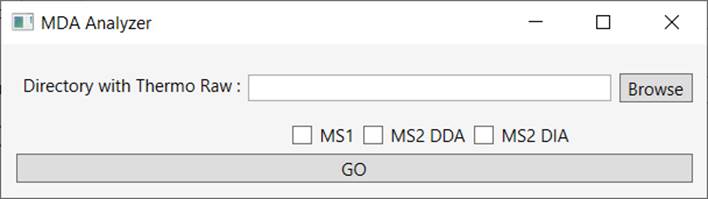
Figure 2 - Extract MS2 DDA from Raw file.
3.
Identify peptides according to PatternLab’s Protocol (DOI:10.1038/nprot.2015.133) using MS2 DDA.
4.
MDA ANALYZER
4.1.
Indicate a directory containing Thermo RAW and SEPro files, specify the ‘PPM
XIC’ and then click on button “GO” (Figure 3),
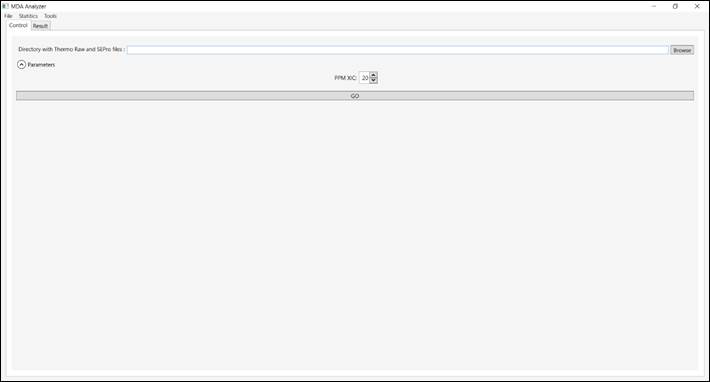
Figure 3 – Analyze data.
4.2.
The left
controls “Options” in the Result tab allow the user to dynamically filter
acceptable results according to:
·
Min MS1 Points:
Minimum number of points consider in XIC.
·
Ion Number: Defines
which products the user would like to consider. This means including ions that will
start from the chosen fragment number (e.g. y1, y2, …, yN and b1, b2, …, bN);
·
Min MS2: Minimum
number of XIC;
·
Most Intense Ions:
Maximum number of most intense MS2 fragment ions.
This tab also presents information related to the peptides was
identified (i.e., sequence peptide, scan number, charge state, MeasureMH,
TheoreticalMH, XCorr, MS1 Area and Number of MS2) (Figure 4).
Double-clicking on one of this panel’s peptide rows causes a window to pop up (Figure
5) for that peptide.
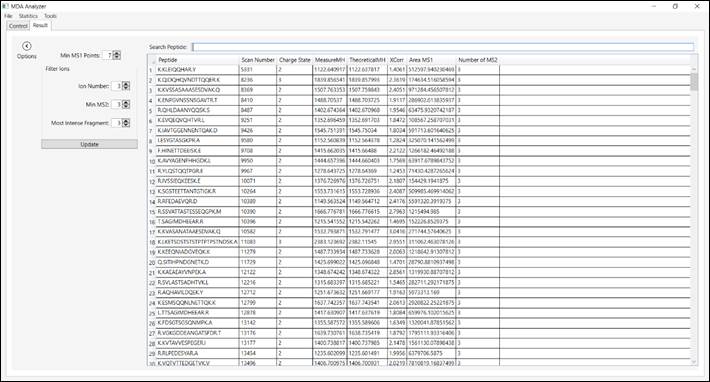
Figure 4 – Information related to the peptide was identified
according and filters.
4.3.
The top section of Figure
5 discriminates MS1 XIC, MS2 XIC, and ALL (i.e., combine MS1 and MS2
XIC’s). We also present annotated peptide. In the upper right corner, the user
can apply smoothing Savitzky–Golay and select which series of ions will be plot
on the graph. The bottom section plots the peptide’s XICs.
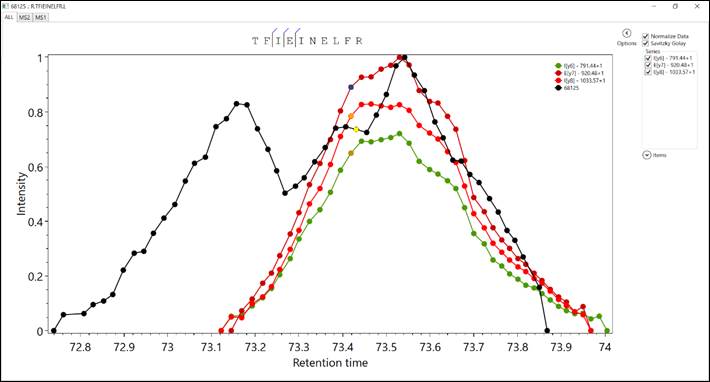
Figure 5 – This window
present information related to the XIC’s peptides.
4.4.
Save the results by
accessing the ‘File’ menu and then choosing “Save As MDA File”. Note that are
available another format, for example, save in
a tab-delimited file for opening
with spreadsheet software
(Figure 6).
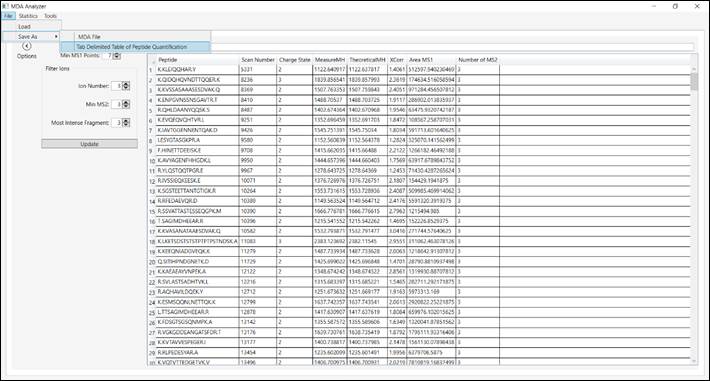
Figure 6 – Save results in different
formats.
5.
STATISTICS
5.1.
Click
on “Statistics”. This menu presents information related to
the spectra (i.e., MS1, MS2, Charge State and Evaluation) (Figure 7).
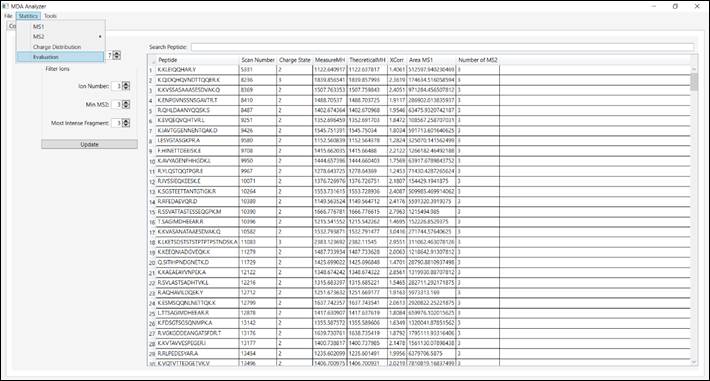
Figure 7 – Information about spectra.
5.2.
The “MS1” tab presents
a histogram of all ions in MS1 (Figure 8).
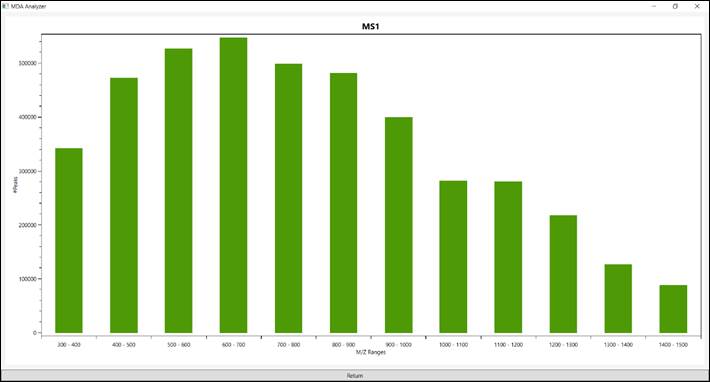
Figure 8 – All ions in MS1.
5.3.
The “MS2 Precursor”
presents a histogram of all precursor’s ions have been fragmented to generate
MS2 DDA (Figure 9).
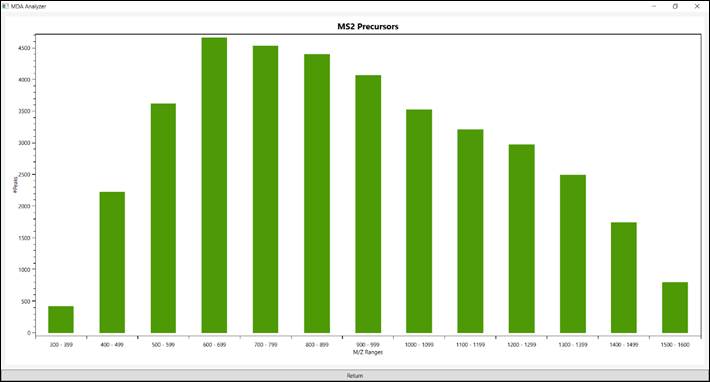
Figure 9 - All precursor’s ions have been fragmented to generate MS2 DDA.
5.4.
The “Charge State”
presents a histogram of the charge state a given peptides were identified (Figure
10).
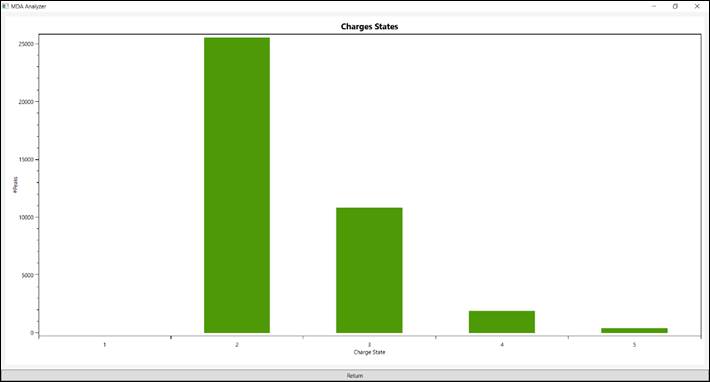
Figure 10 - Charge state peptides were identified.
5.5.
The
“Evaluation” provides some information on raw file, such
as number of survey scans, number of DDA MS2, number of spectra in DIA MS2,
total number of spectra, duty cycle time (i.e., time from MS1 to the other MS1)
and time of chromatography (Figure 11).
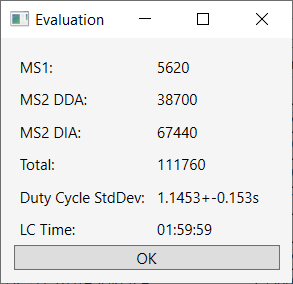
Figure 11 – Evaluation raw file.