PROTOCOL
MS1Q
requires two files to function:
1. A Thermo mass spectrometer RAW files.
2. A Search Engine Processor (DOI:10.1002/pmic.201100529) SEPro
files. A *.sepr file is provided by
PatternLab´s Search Engine Processor module, which applies a series of
statistical filters to results provided by SEQUEST, ProLuCID,
or preferably, COMET which is integrated into PatternLab.
3. Example dataset can be downloaded here.
HOW TO USE
1.
Installing MS1Q
The
latest version of the MS1Q software is available here. The software requires version
4.7.1 or up of the .NET framework, which will be automatically installed if necessary.
2.
Selecting
the files
2.1. Indicate a directory
containing Thermo RAW and SEPro files (Figure 1).
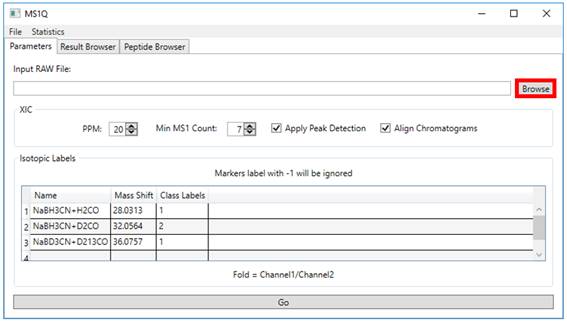
Figure 1 Starting MS1Q Screen.
2.2. Specify the ‘PPM’, ‘Min
MS1 Count’, ‘Apply Peak Detection’ and ‘Align Chromatograms` parameters (Figure 2).
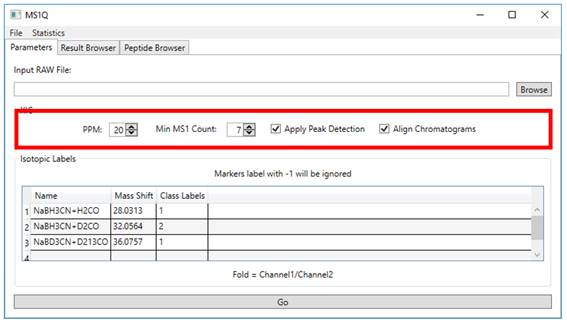
Figure 2
2.3. Isotopic labels must be
specified inserting ‘Name’, ‘Mass Shift’ and ‘Class Labels’. Specify the ‘Class labels’ parameter for each
channel. As this is a pairwise comparison, only 1 and 2 should be used as
labels. In case a channel is not to be included in the statistics, it should be
labeled as −1 (Figure 3).
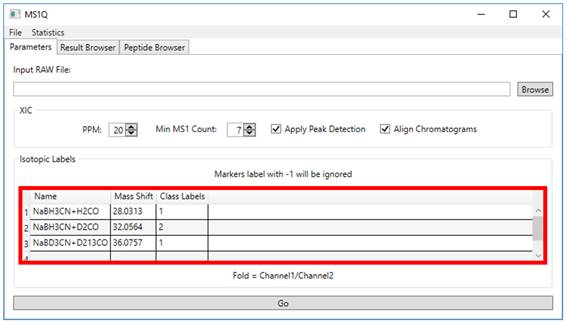
Figure 3
2.4. By click on Go button (Figure 5). The results will be displayed on Result
Browser tab, as you can see in (Figure 6).
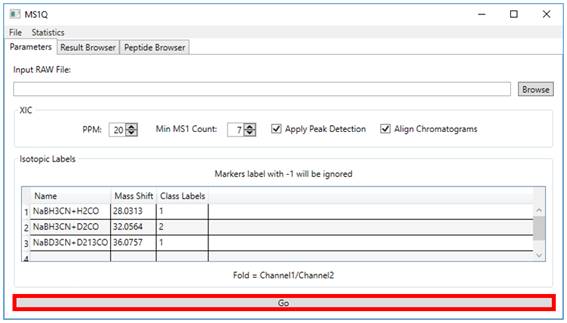
Figure 5
2.5. The top controls in the Result Browser tab allow the user to dynamically
filter acceptable results according to ‘only unique peptides’, only peptides
that present an absolute ‘fold change’ greater than a specified ‘log fold
change’ value and, lastly, only proteins containing at least a user-specified ‘number
of peptides’ satisfying these constraints (Figure
6).
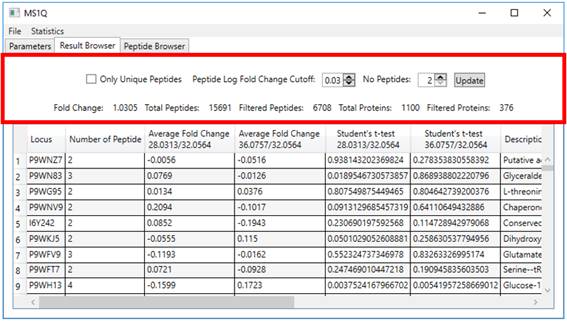
Figure 6
2.6. Clicking on a protein row will open
a window providing information at the peptide level, such as average fold
change and spectral count, for that protein (Figure 7).
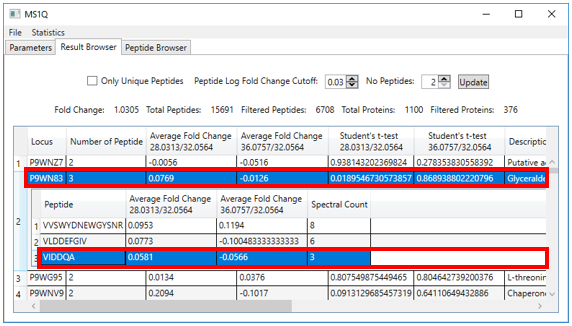
Figure 7
2.7. Double-clicking on one of this panel’s peptide rows makes a window with
chromatographic details used for the XIC pop-up (Figure 7).
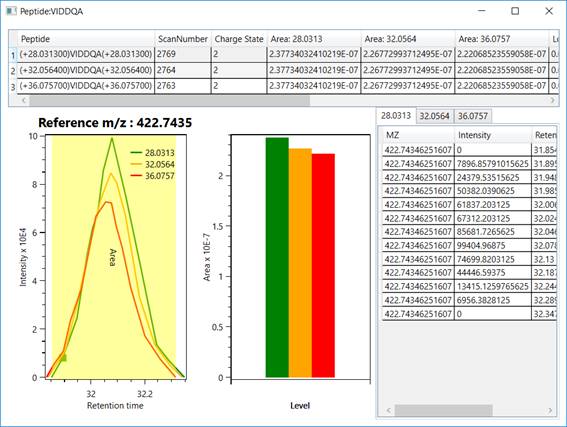
Figure 8 - The top section discriminates the peptide´s
identifications, providing for each one it´s scan number, charge state, XIC
areas, log fold changes, experimental mass-to-charge ratio, and file name. The bottom section plots the peptide’s XIC (e.g., light, intermediate, and heavy) and areas,
along with the experimental data used for generating the XIC plot, on the
right.