Release Notes
Version 1.5.7.6
November 24th, 2025
-
(NEW) Export results in csv format.
⇒ After obtaining the results, go to File menu → Export Results → Results Report (or press ALT + E). Then, in Save as type, select CSV file; type a file name and click on Save.
Version 1.5.7.1
July 6th, 2022
-
(NEW) Isotope envelopes: Now, it's possible to visualize the isotope envelope for a specific identification (Figure 1) from Thermo™ RAW files. To do so, two ways are enable to obtain the isotope envelopes (on MS1 level):
- For older results, go to Utils menu → Isotope Envelopes (or press ALT + W). A new window will be opened. Select the directory where the Thermo™ RAW files are, and press OK button. The isotope envelope for all identified cross-linked peptides will be obtained.
- For new results, the isotope envelopes will be automatically incorporated into the results.
⇒ To export all isotope envelopes, go to File menu → Export Results → Isotope Envelopes (or press ALT + CTRL + I).
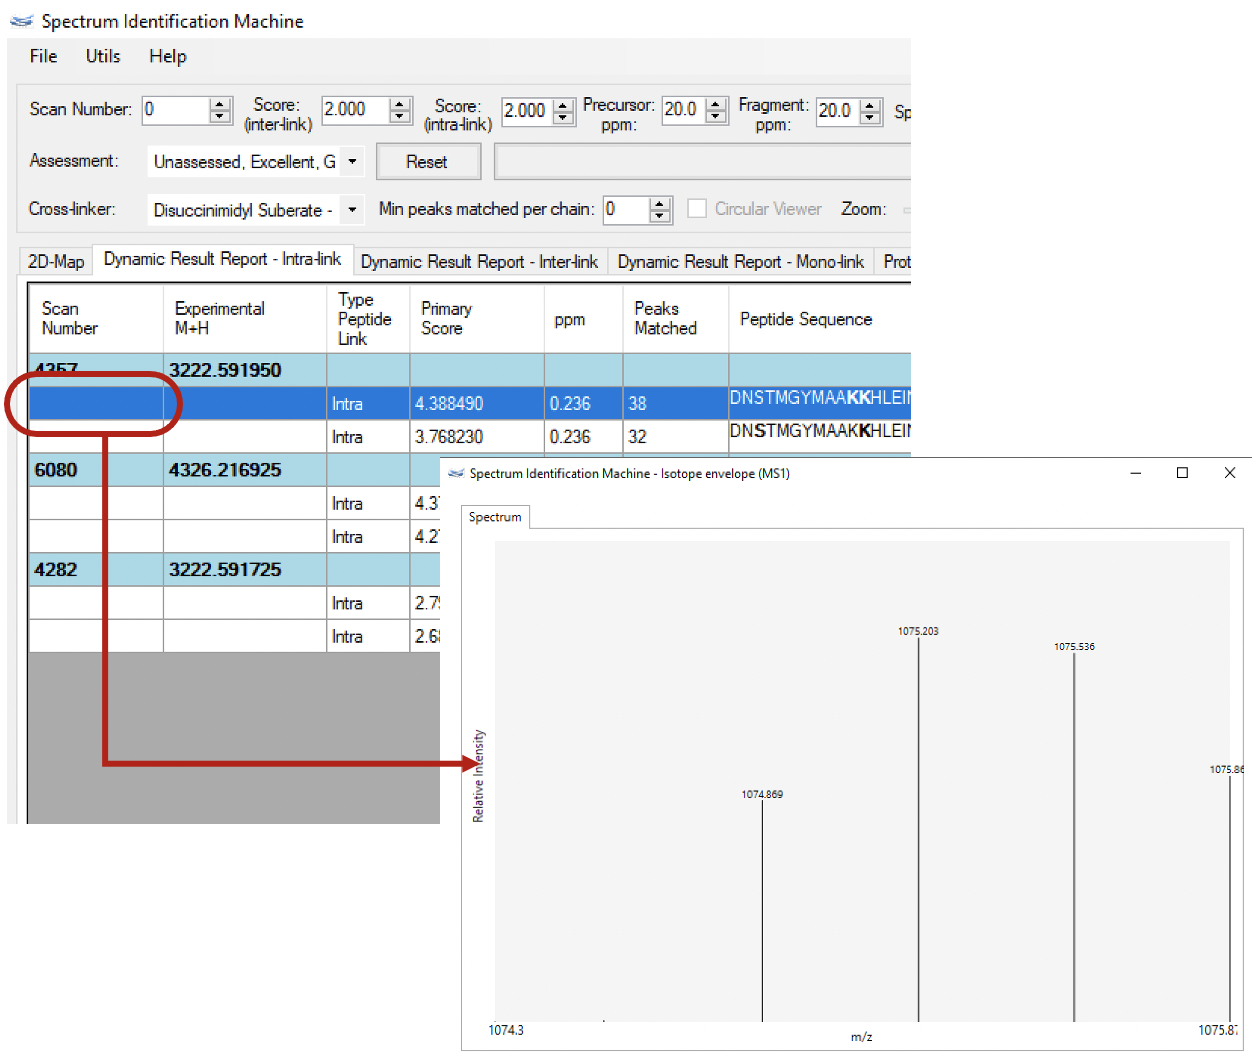
Figure 1
Version 1.5.6.1
May 26th, 2022
- (NEW) Export results to ChimeraX: Now, it is possible to export the identified cross-linkings to ChimeraX. To do so, go to File menu → Export Results → ChimeraX Script (or press ALT + Shift + C).
Version 1.5.5
March 9th, 2021
- Optimized the method responsible for reading Thermo® RAW files.
- Optimized the method responsible for reading mzML files.
- Optimized process to save domains colors.
- Fixed peaks matched that represent the cross-linker reaction in the Peptide annotation (Spectrum Viewer).
- Fixed bug in the homodimer analyses.
Version 1.5.4.3
September 2nd, 2020
- Fixed Protein Heat Map hit summary export method: The report is generated by sorting all reaction sites from the smallest to the highest value (n- to c-term) when the reaction generates is done on the same protein.
- (NEW) FDR on CSM level: Now, it is possible to apply a FDR on CSM (cross-link peptide-spectra matching) level, when the database contains many protein sequences.
Version 1.5.4
February 7th, 2020
- (NEW) Export 2D map to PostScript file: Now it's possible to export the protein-protein interaction map to *.ps format file. To export it, go on File menu → 2D-Map → Save image (or press ALT + I) and select Ps Image in 'Save as type' field.
- (NEW) Read Thermo RAW files: SIM-XL now uses Thermo RAW File Reader library embedded in the software.
Version 1.5.3
January 24th, 2019
- (NEW) Charge State and ppm Distributions: Now it's possible to draw the charge state and ppm histogram of the identified cross-linked peptides. These features are available when a result is loaded in Results Browser. To enable them, after loading a result, click on Utils menu → Distribution and choose between Charge State or ppm histogram (or press ALT + P or CTRL + ALT + P, respectively).
- (NEW) Spectrum Viewer - XL Residues: It's possible to show all identified residues which represent a XL reaction. To enable this feature, after open a spectrum, go on Utils menu → Custom Spectrum Viewer, select the XL Residues checkbox, and click on 'OK' button.
Version 1.5.2
November 4th, 2018
- (NEW) Protein Domain: Now it's possible to obtain all protein domains directly from PFAM server, just clicking on button (as shown in Figure 1). All required fields will be filled automatically, besides the PFAM score, e-value.
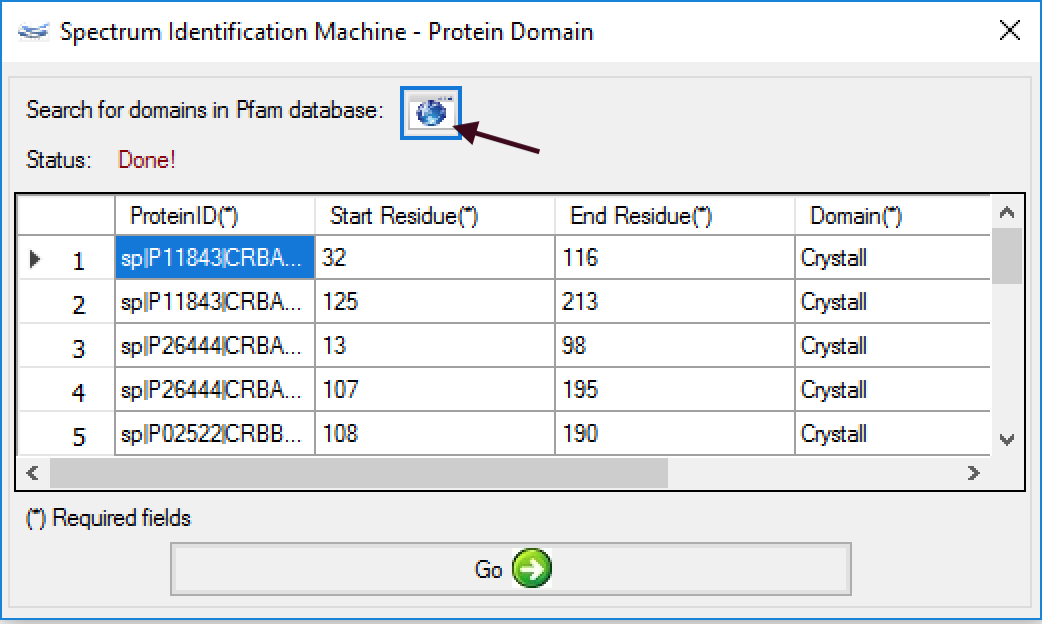
Figure 1
Version 1.5.1.14
October 3rd, 2018
- Optimized search engine to reduce up to 70% the processing time compared to the previous version.
- (NEW)Spectrum Viewer: Now it's possible to customize the peaks and font of a spectrum. For this, go to Utils menu → Custom Spectrum View, and you can increase/decrease the font size, to enable or not the bold style, and enlarge the width line of the peaks matched.
- Spectrum Viewer: Exchanged the position of 'Peptide Annotation' and 'Deviation Plot' tabs.
- Removed the parameter 'Max Memory (%)' because in the current algorithm this management is done automatically.
- The default parameters were changed to: Max MH (Linear pept): 4800Da and No. Isotopic Possibilities: 3. These numbers represent a good values to find out the maximum of results.
- The cross-linkers were separated in 'with reporter ions only' and not. Now, there are two options for each XL: one which considers the reporter ions on the search, and the other which does not consider them.
Version 1.5.1.4
July 25th, 2018
- (NEW) Spectrum Viewer: The fragment ions can be exported in a Excel® file (*.xls) through the File menu → Export → Fragment Ions (or pressing ALT + SHIFT + F). The export file will reflect exactly the data grid table on 'Spectrum Identification Parameters' tab.
- Optimized XIC algorithm for calculating the quantification.
Version 1.5.1.3
June 28th, 2018
- The results output file in mzIdentML format (*.mzid) was updated according to the v. 1.2 schema validation of PSI.
- Bug-fixed: Generation of mzIdentML file for homodimer analysis was optimized.
- (Important) Bug-fixed - Homodimer analysis: 'heavy' peptides, which have ptm's were discarded. Now, this problem was fixed.
Version 1.5.1.1
June 25th, 2018
- Bug-fixed: The fusion method was optimized for files of older versions.
- Bug-fixed: The protein identification and quantitation features were optimized.
- Bug-fixed: The export method for TopoLink script was reorganized.
- (NEW) Result Browser: Species Count - The results can be filtered by species count.
- (NEW) Result Browser: Protein Domain - The user can specify a domain for each identified protein according to some parameters: protein region, name, and color. For it, the user needs to go to Utils menu → Protein Domain (or pressing ALT + D), as shown in Figure 1.
A new window will be opened (Figure 2); a ProteinID, a range of the protein domain, a name, and a color need to be filled.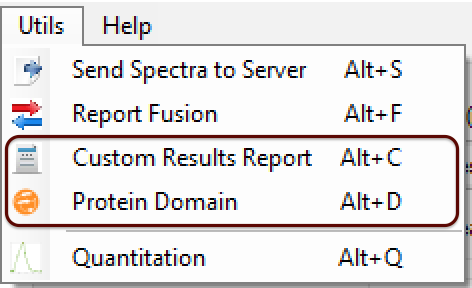
Figure 1
After that, a new 2D map will be plotted, as can be shown in Figure 3. When the user mouse over the domain, its name is shown.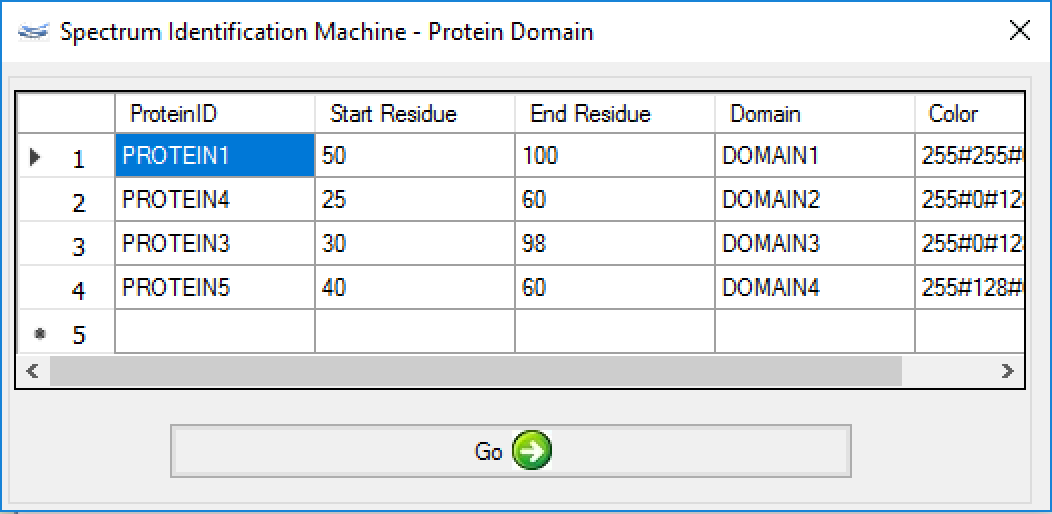
Figure 2 - (NEW) Result Browser: Cross-linker color change - Now, it's possible to change the intralink color for each cross-linker. For it, the user needs to go to Utils menu → Custom Results Report (or pressing ALT + C) and (Figure 1) changes the Color field (Figure 4).
After to choose the color, press the 'OK' button. A new 2D map will be plotted with the new colors (Figure 5).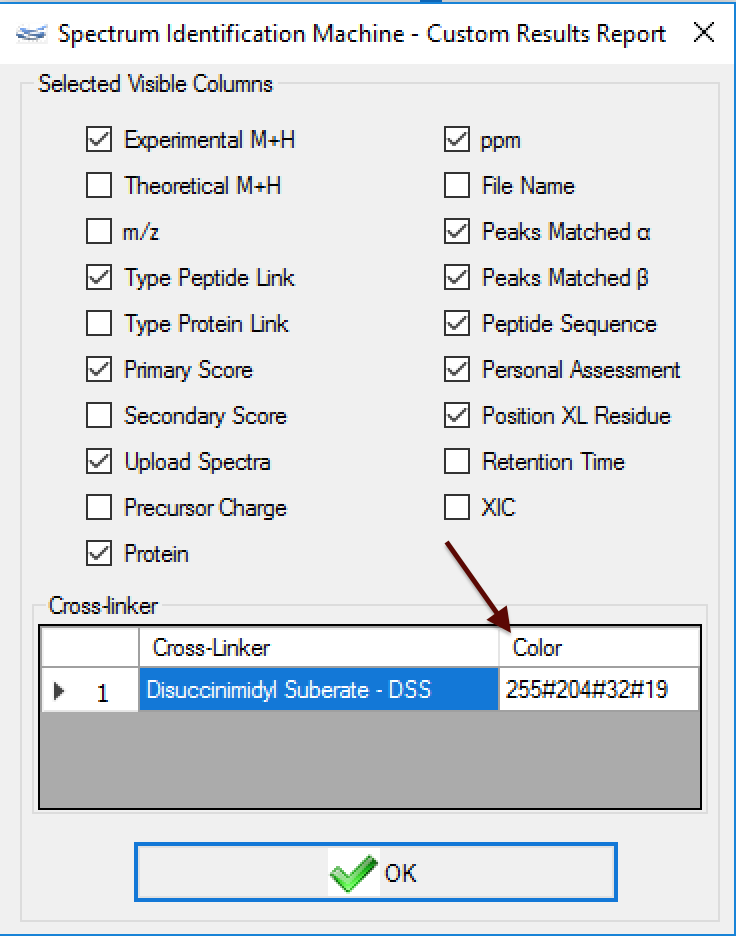
Figure 4
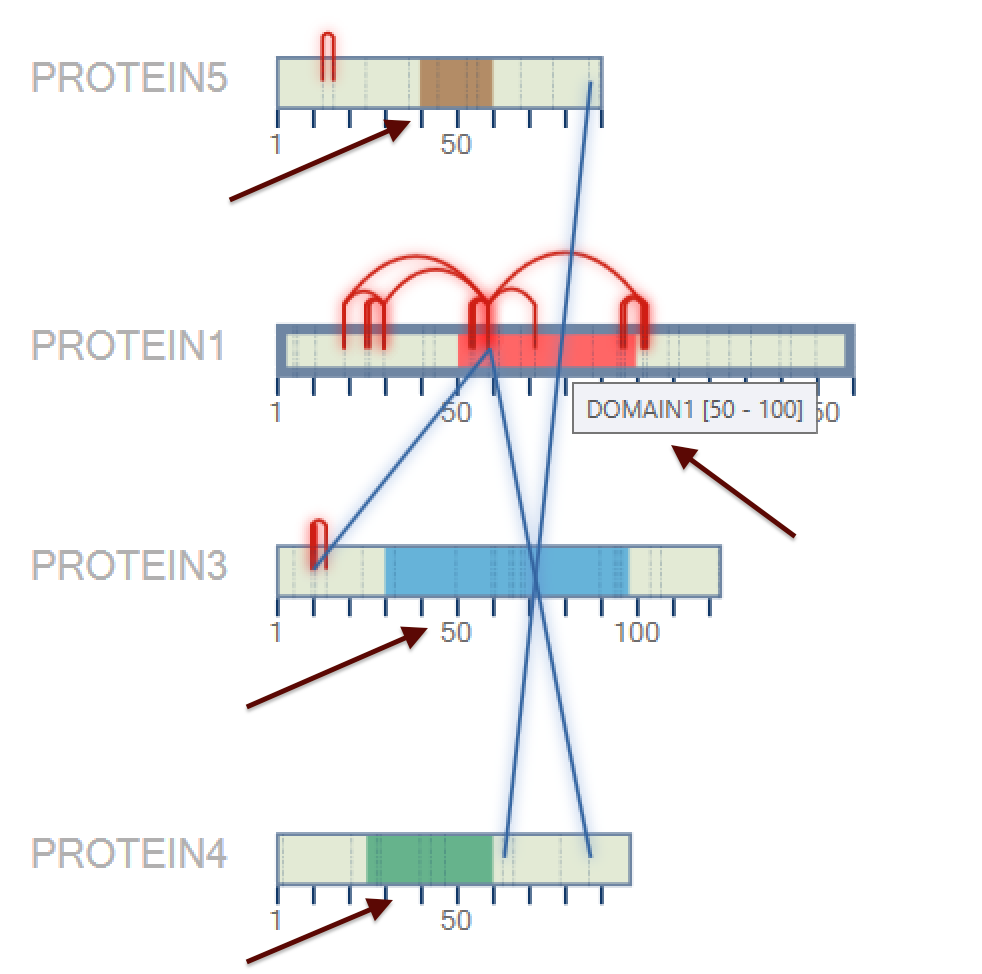
Figure 3
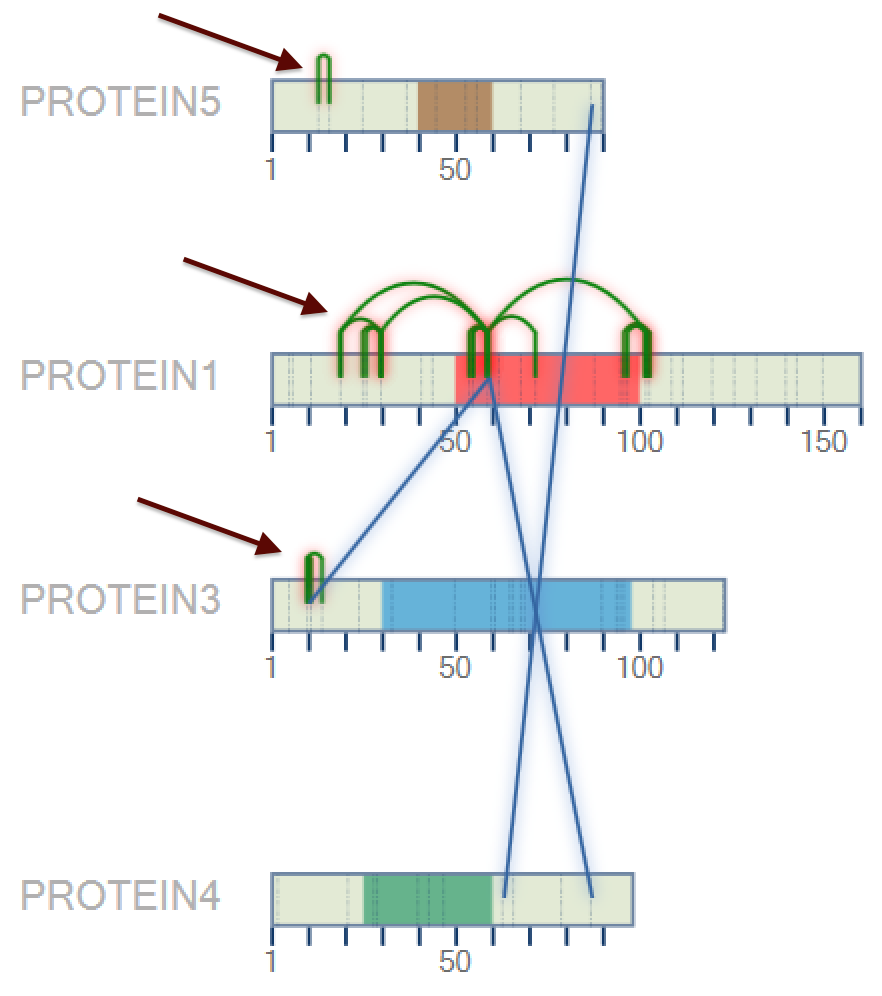
Figure 5
Version 1.5.0.10
April 5th, 2018
- Optimized method to identify cross-linked peptides. The processing time is reduced by half of the previous version.
- Optimized method for saving results.
- (NEW) Result Browser: Cross-linker filter - Now, it's possible to filter all results from a specific cross-linker when the search is performed using more than one, e.g., XPlex case.
- Spectrum viewer: Zoom in and out was optimized to show all selected area. (Figure 1)
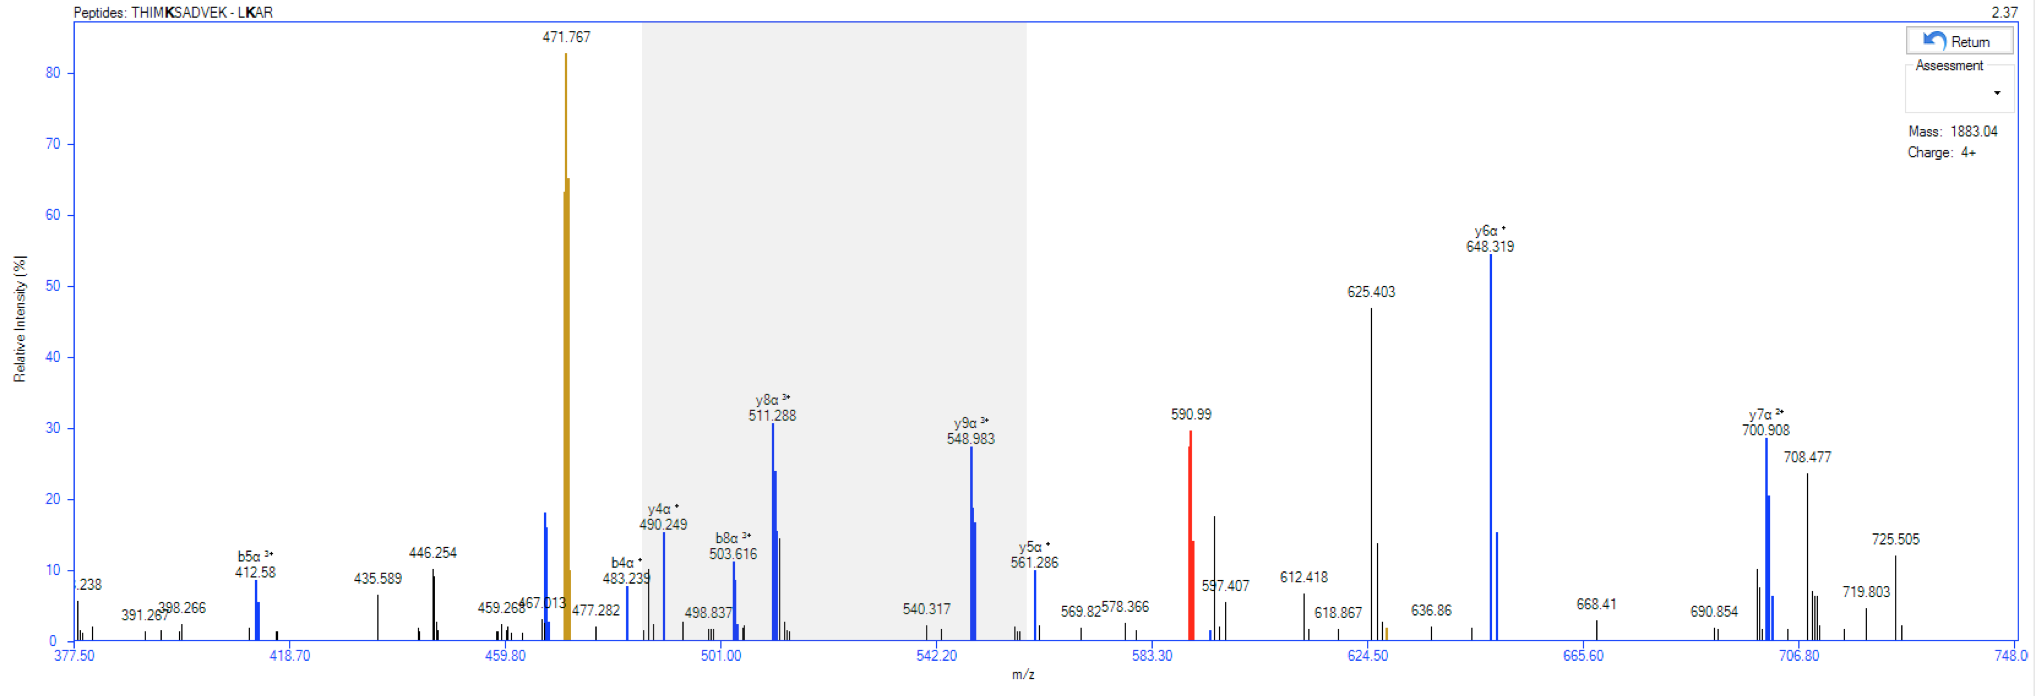
Figure 1
Version 1.4.X
Version 1.4.2.1
January 8th, 2018
- Optimized method to identify cross-linked peptides.
- Quantitation module: It's possible to visualize the isotope envelope for a specific XIC. (Figure 1)
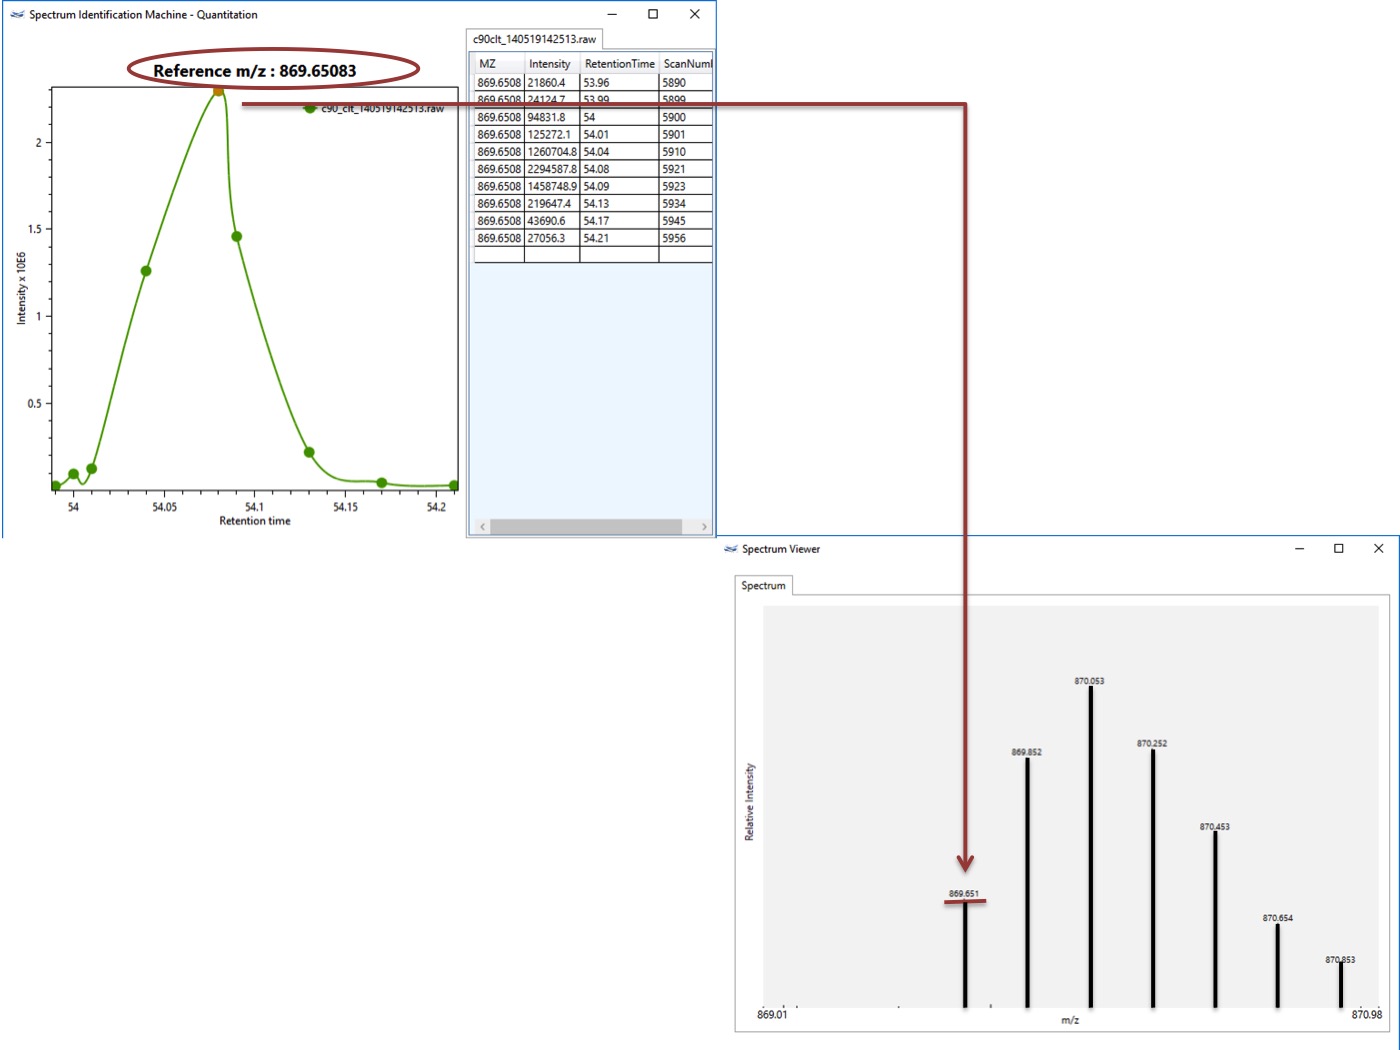
Figure 1
Version 1.4.1.5
October 31st, 2017
- Optimized the method to save all identifications.
- Bugs fixed to perform analysis. C-term searches were optimized.
Version 1.4.1.3
September 11th, 2017
- AB Sciex® raw files are supported!
SIM-XL is enabled now to read directly from AB Sciex® RAW files, Agilent® RAW files, Waters® RAW files, Thermo® RAW files, MS2, Mascot Generic Format (MGF) and mzML 1.1.0. - Bugs fixed to perform analysis.
- Bug fixed to display the Spectrum Viewer through the Protein Heat map.
- Bug fixed to display the spectrum count on Protein Heat map.
- Bug fixed for reading Agilent® files.
Version 1.4
August 11th, 2017
- (NEW) Quality Control Filter (Xrea): Xrea is a signal-to-noise score proposed by Na and Paek, that only considers relative and cumulative intensities without taking into account the distribution of intensities along the m/z axis. A high Xrea score usually means a spectrum with some distinctive peaks in relation to other, low-intensity peaks. On the other hand, a low Xrea means a spectrum with many peaks of close intensity all over, that is, a spectrum in which it is difficult to discriminate between signal peaks and noise peaks. So, this filter removes all spectra which contains a Xrea score below than threshold value, set up as default 0.2 (Figure 1).
- (NEW) Mono-link search: All cross-linking searches will be performed in two steps: i) Comet will be used to find out all linear and mono-link peptides. All identified spectra of the linear peptides will not be searched in the cross-linking step. All identified mono-link peptides will be shown in the 2D-map, as well as, all reaction sites will be flagged (dash-line) on the protein representation (Figure 2). ii) SIM-XL search engine will be used to find out the cross-linkings.
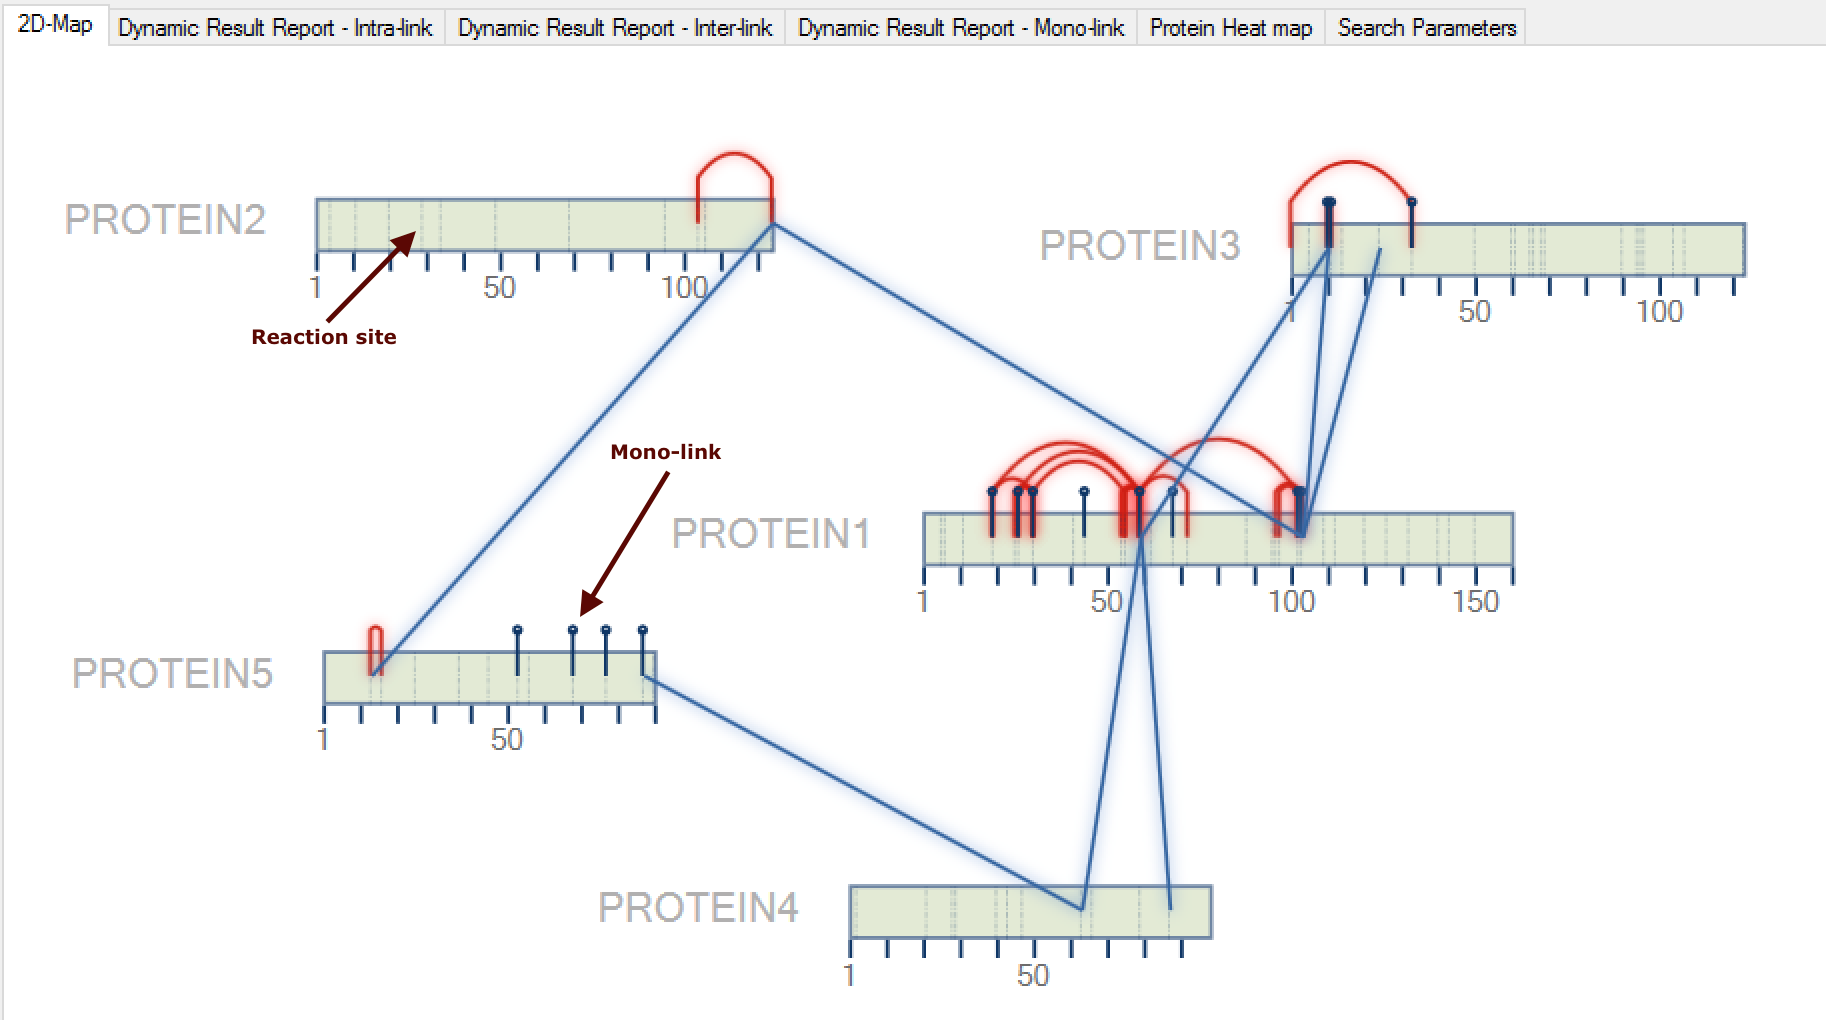
Figure 2- All identified mono-links will also be shown in a specific tab termed Dynamic Result Report - Mono-link (Figure 3), which can be visualized all information about each identification (e.g. scan number, Comet score - Primary Score - etc.) and by double-clicking on a specific mono-link, a new window will be opened showing the spectrum viewer.
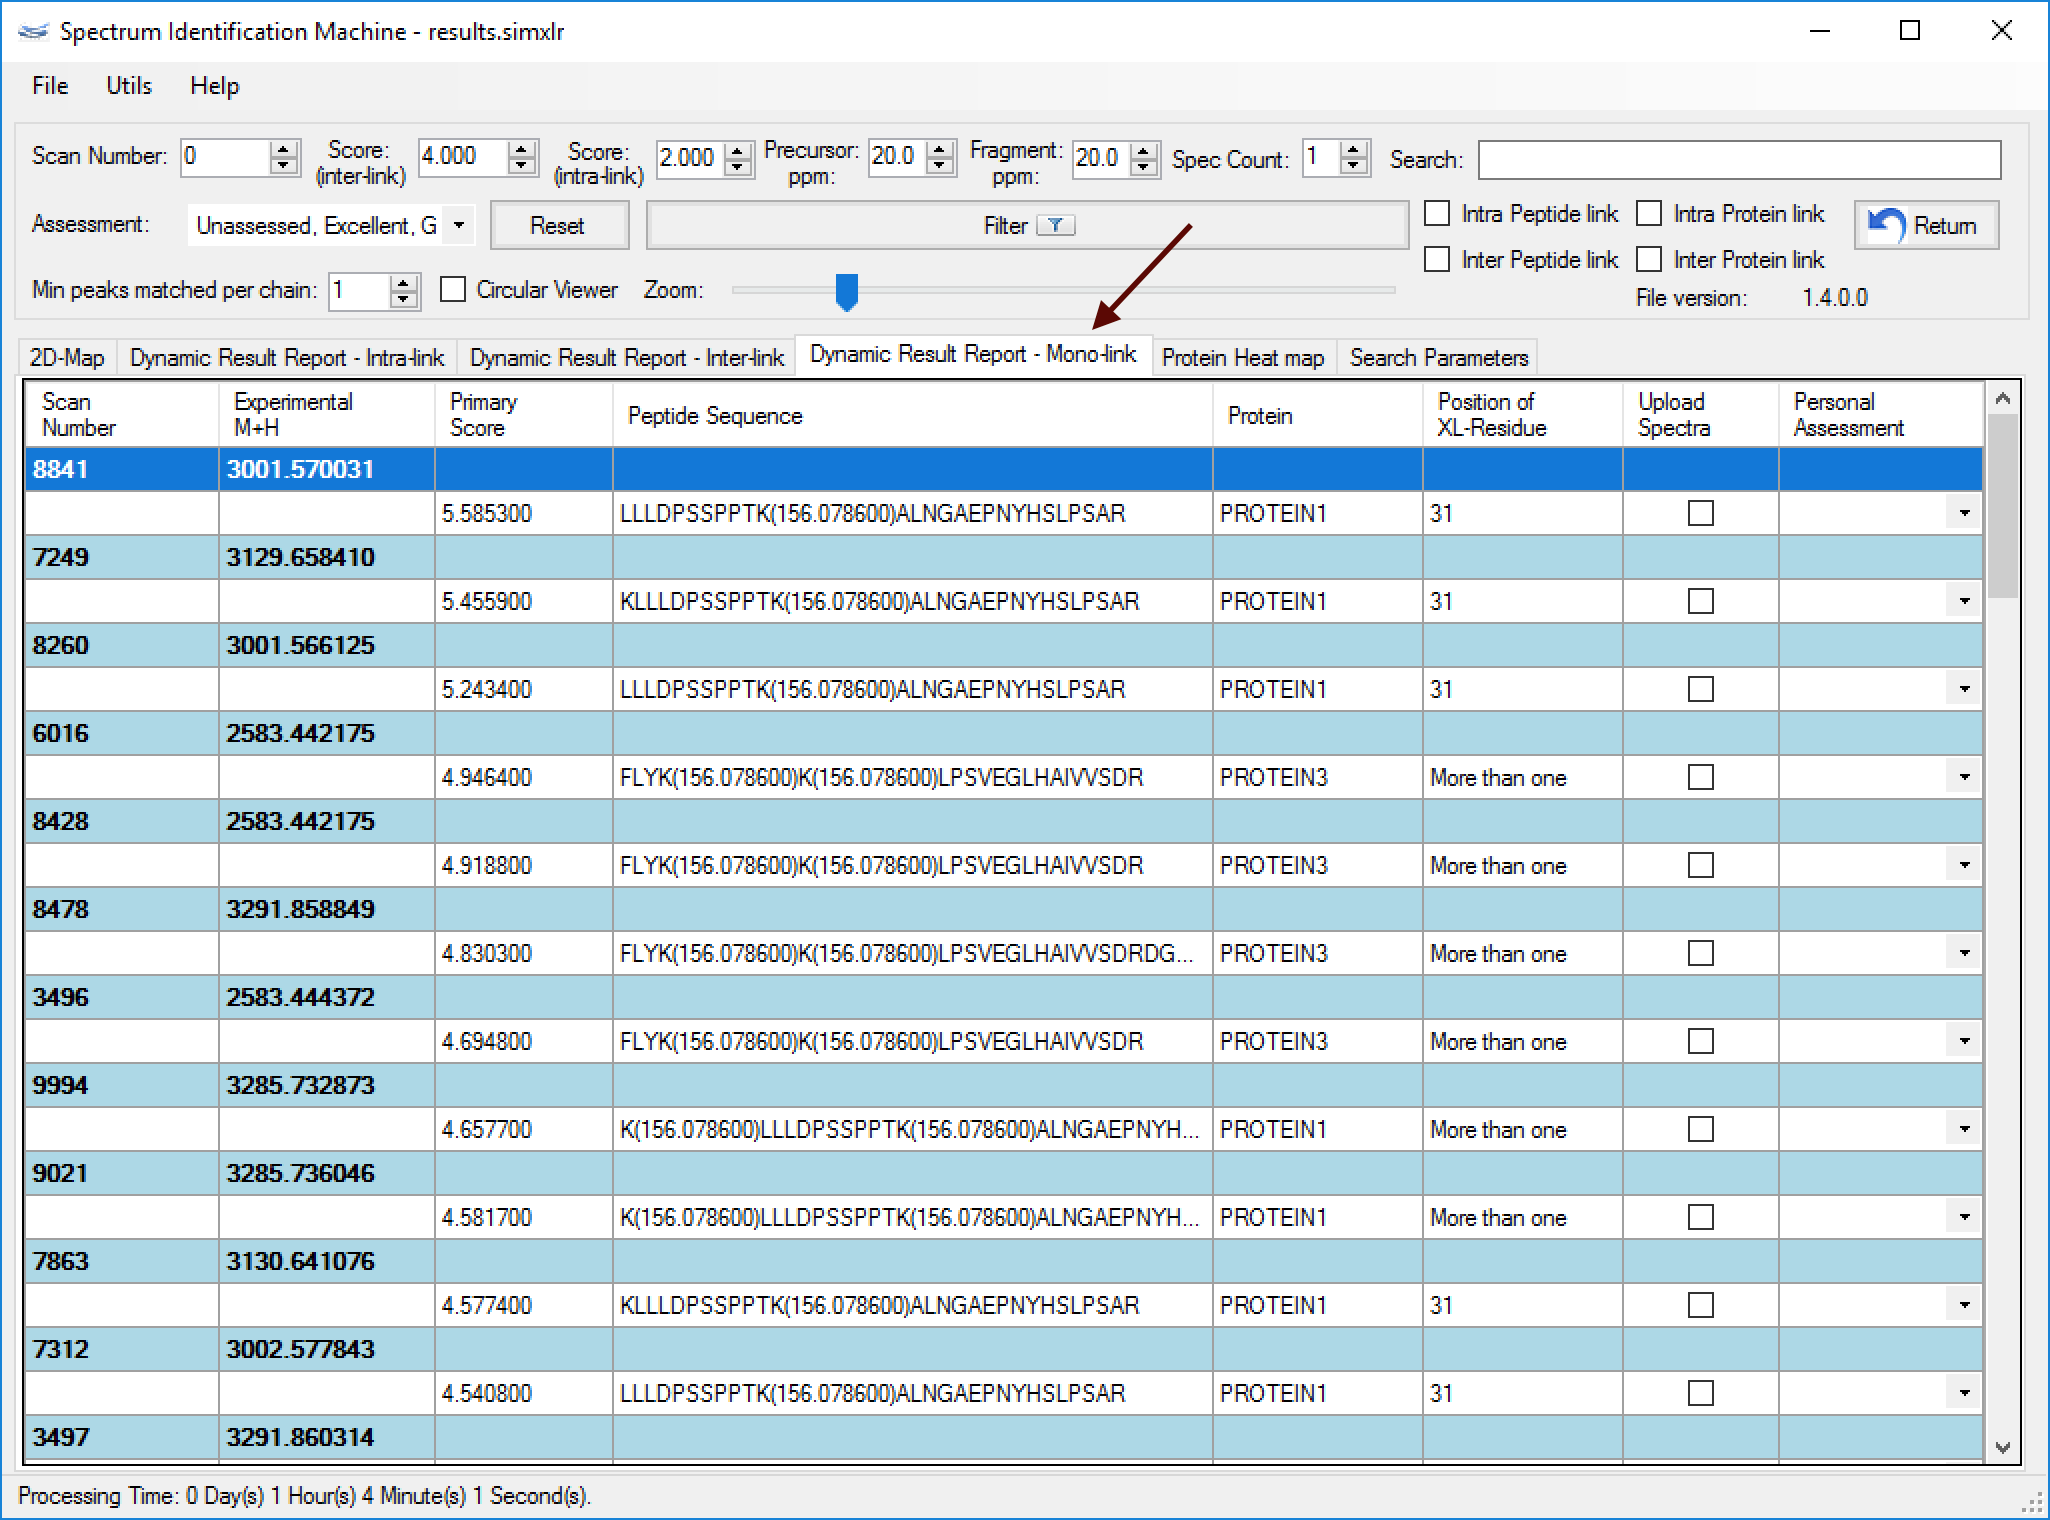
Figure 3⇒ This feature is not able to perform homodimer analysis.
- (NEW) Protein sequence coverage: By double-clicking on the protein representation, a new window will be opened showing the protein sequence coverage, as can be seen in Figure 4.
- Optimized homodimer searches.
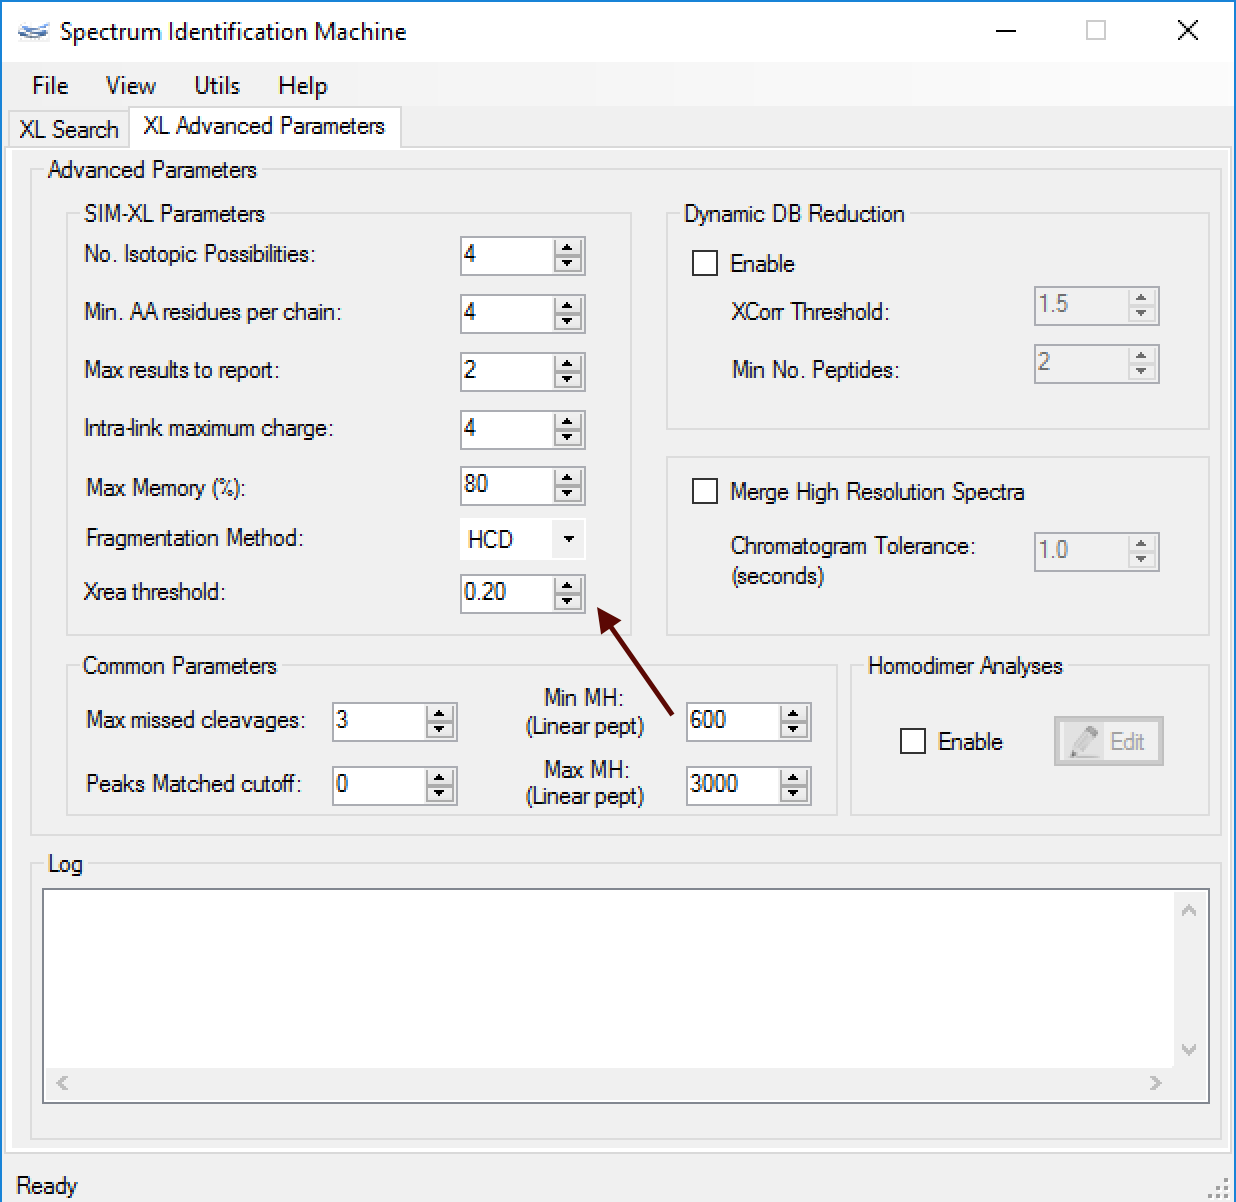
Figure 1
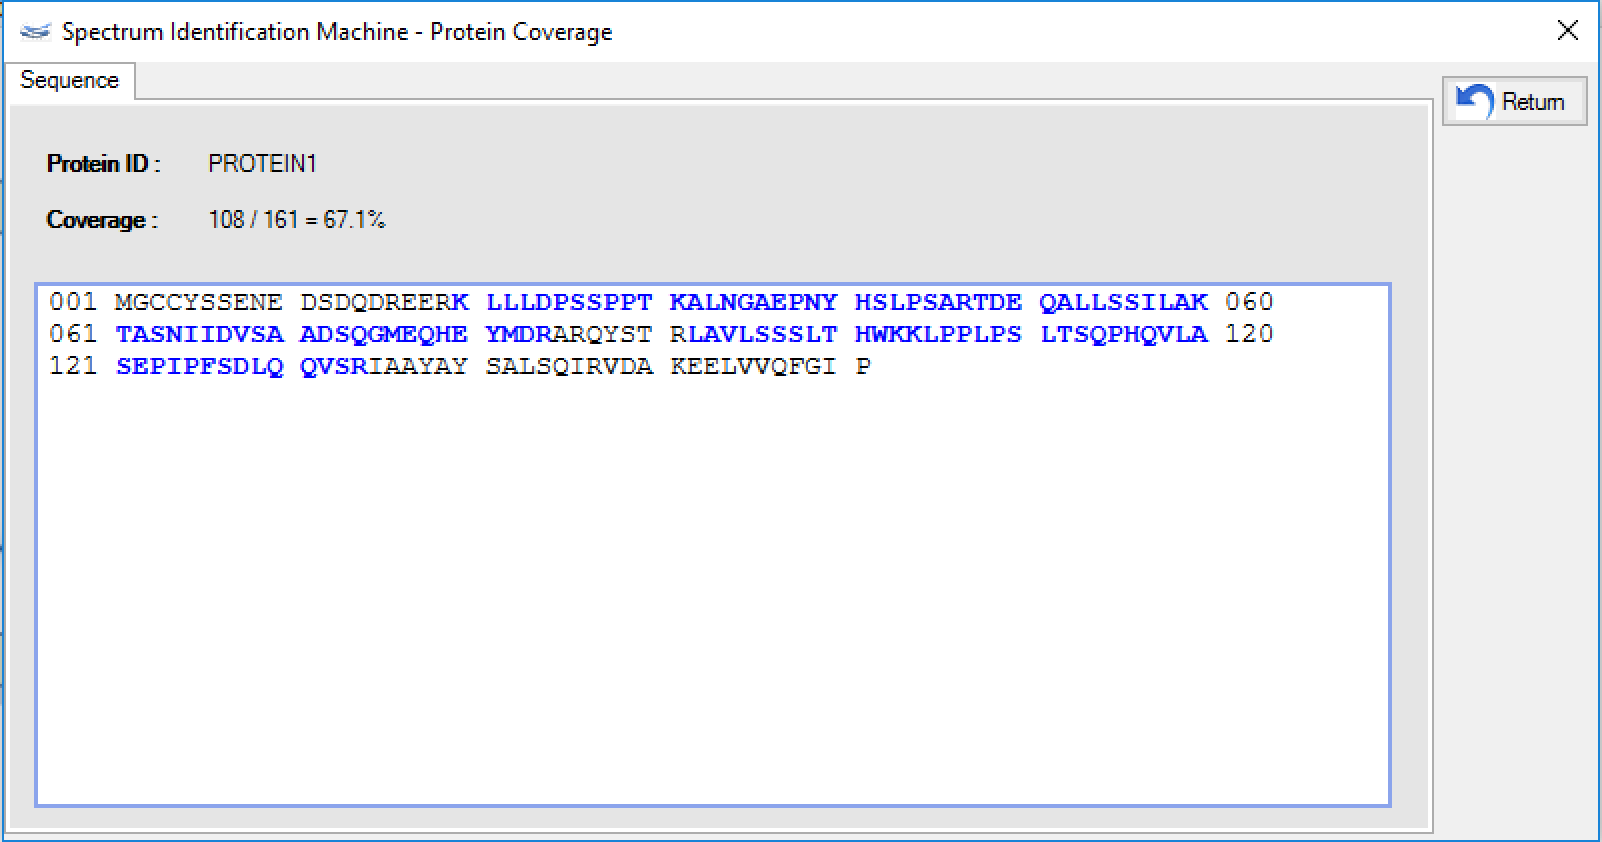
Figure 4
Version 1.3.X
Version 1.3.3.2
June 22nd, 2017
- (NEW) Protein heat map features:
- Graph view: Now the user can visualize a 2D graph with all identified links. (Figure 1)
- Species counting: A new filter can be done to obtain how many different species there are in a specific link.
Note that the cell values will show how many different species each link has, rather than how many spectra. (Figure 2)
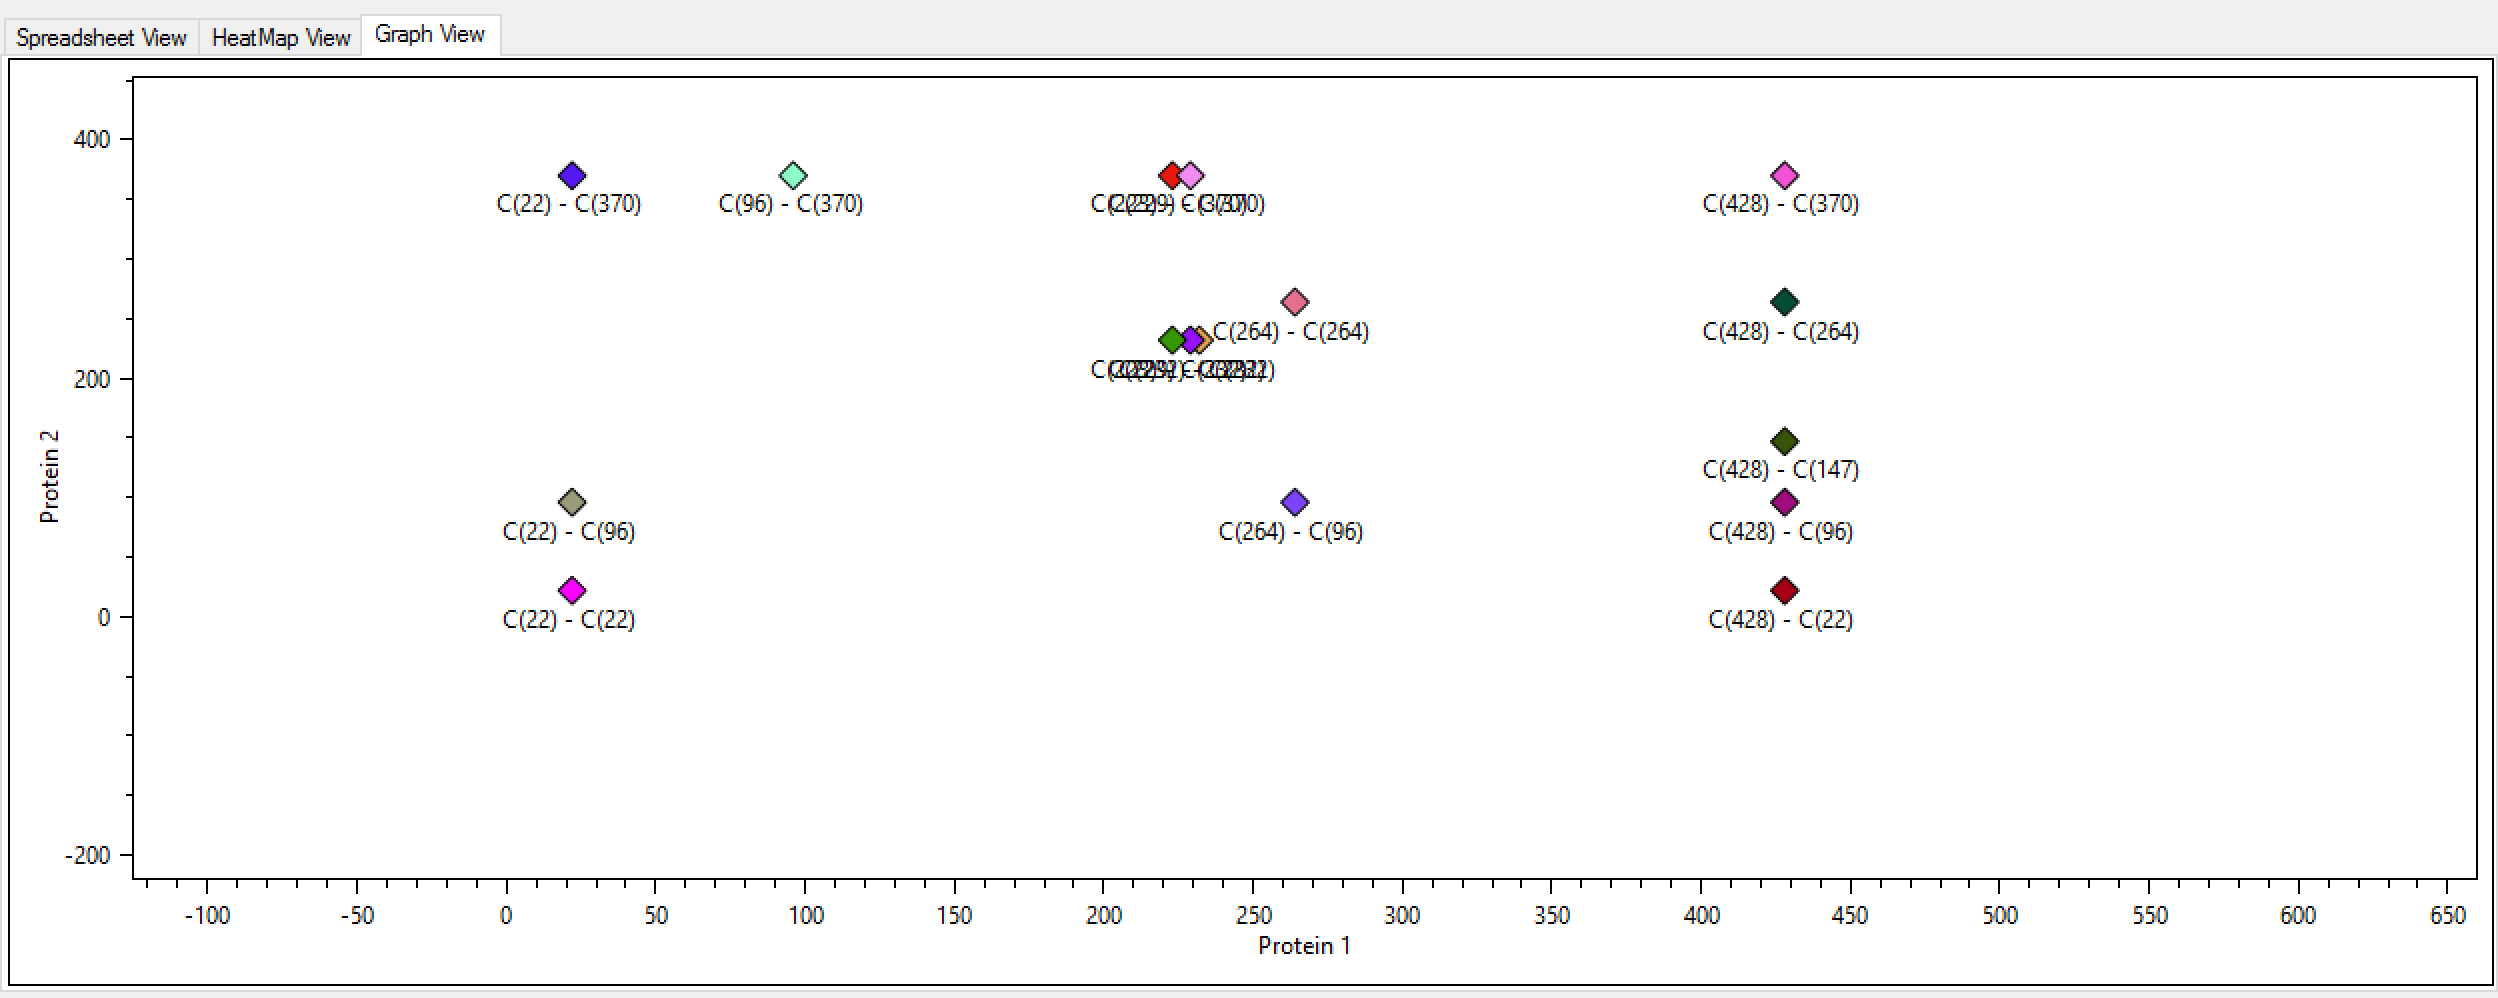
Figure 1
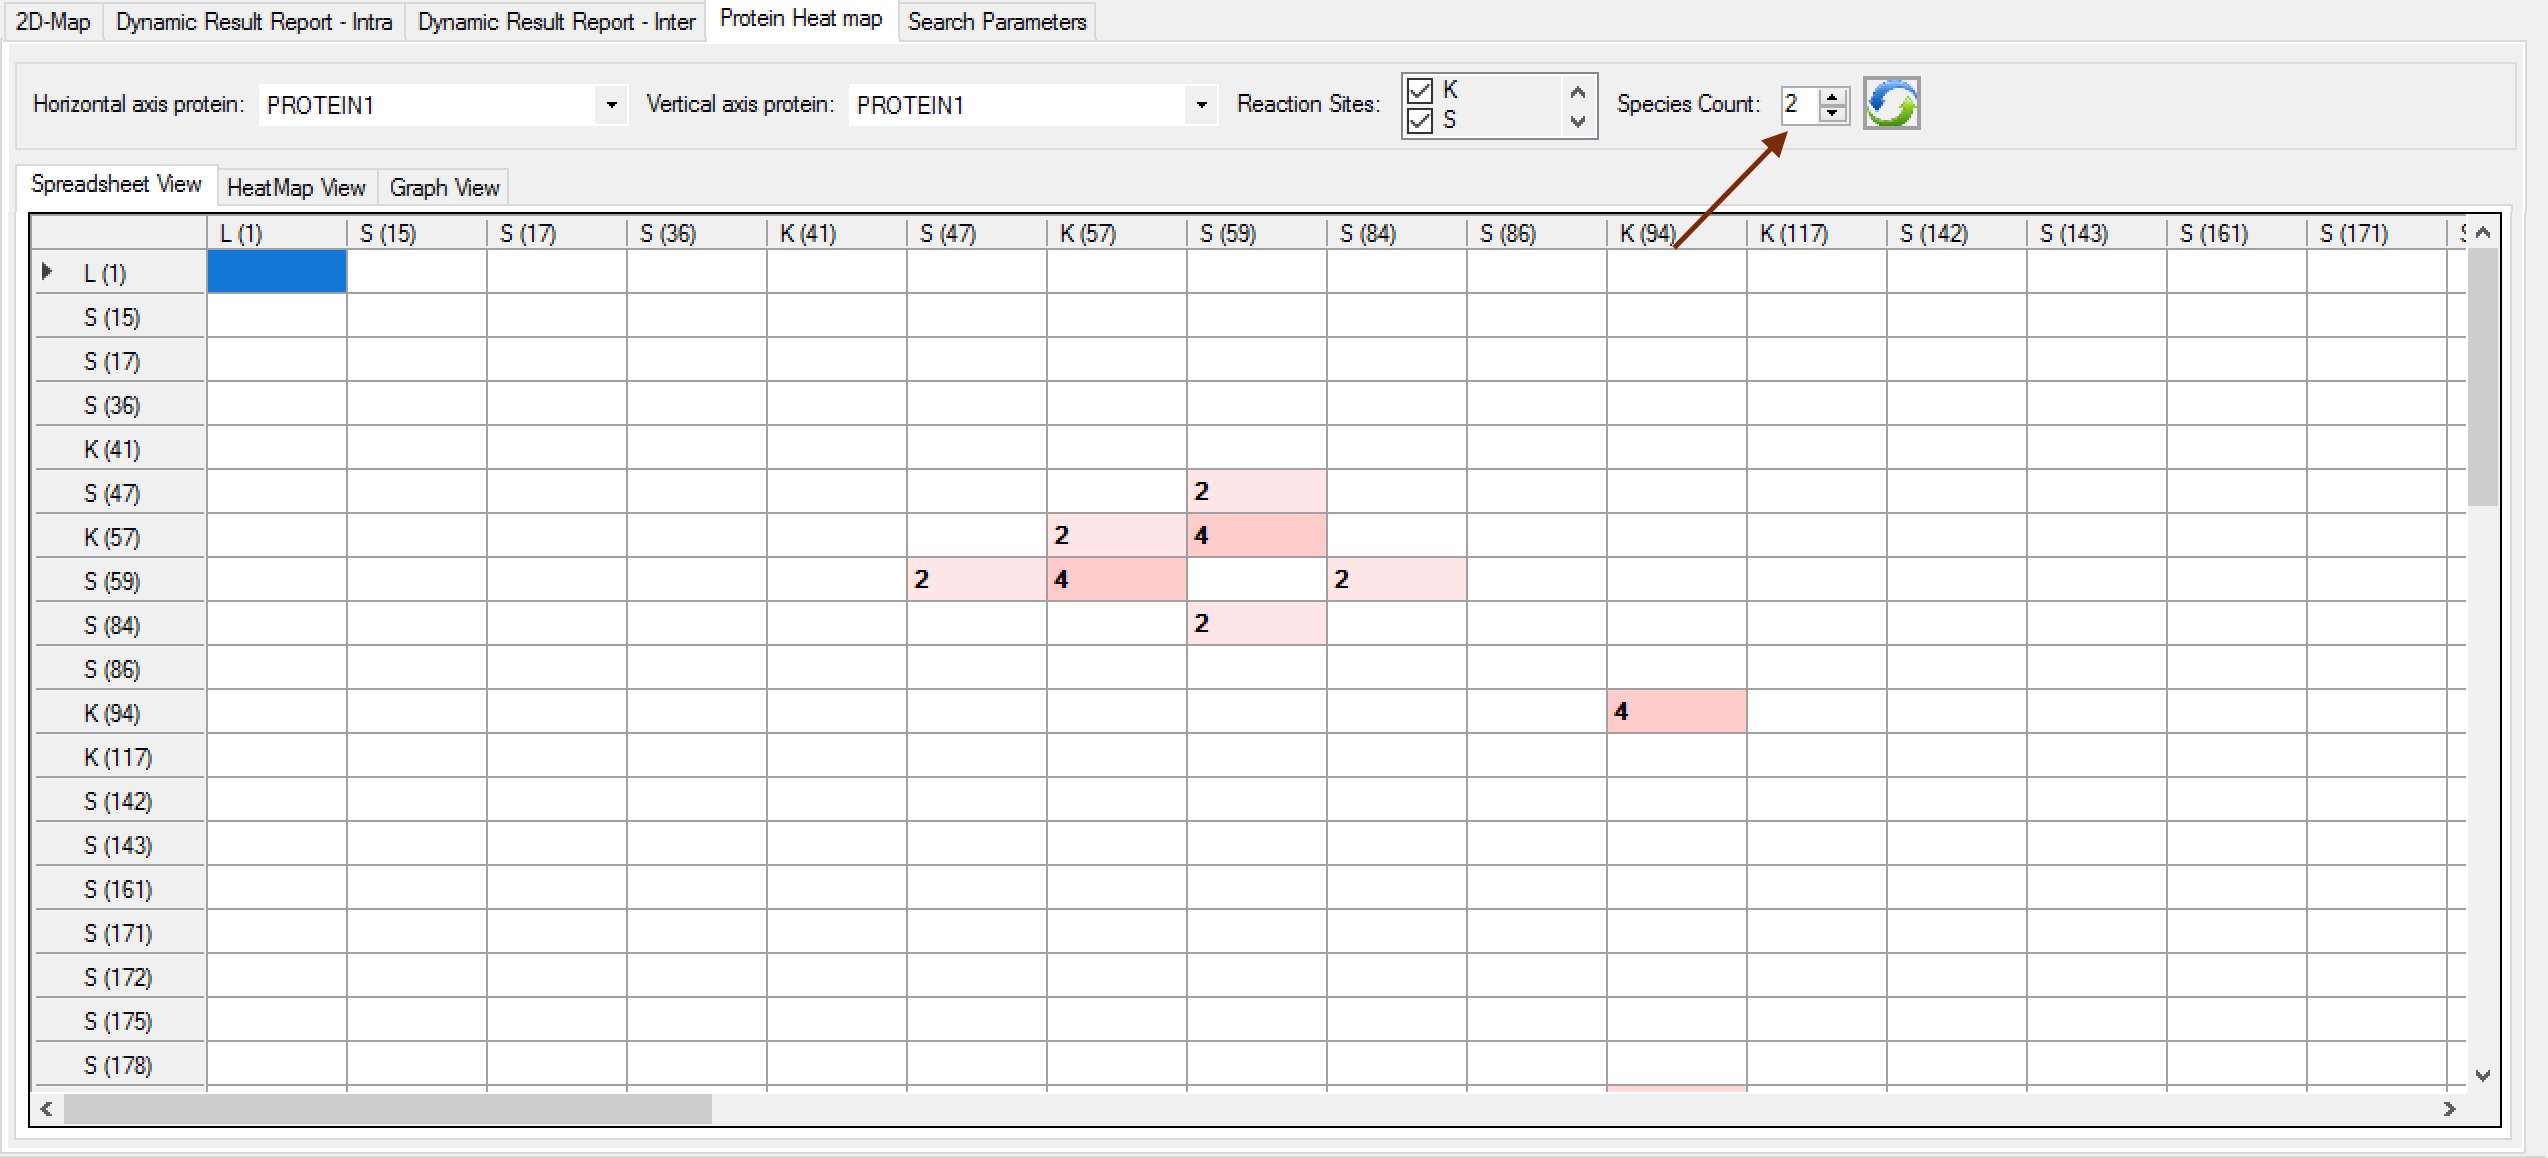
Figure 2 - Bug fixed in the search engine about the c-terminal searches.
Version 1.3.2
May 23rd, 2017
- Agilent® RAW Files are supported!
SIM-XL is enabled to read directly from Agilent® RAW files, Waters® RAW files, Thermo® RAW files, MS2, Mascot Generic Format (MGF) and mzML 1.1.0. - (NEW) XL Quantitation:
- Now it's possible to perform XL quantitation using Agilent® and Thermo® RAW files.
- Updated mzIdentML parser to 1.2 version.
- Bugs fixed to perform homodimer analysis.
Version 1.3.1
April 12th, 2017
- Waters® RAW Files are supported!
SIM-XL is enabled to read directly from Waters® RAW files, Thermo® RAW files, MS2, Mascot Generic Format (MGF) and mzML 1.1.0. - Bugs fixed to set up some homodimer parameters.
- Bugs fixed to filter some results with variable PTMs.
Version 1.3
January 23rd, 2017
- Spectrum Viewer: The Dynamic Result Report was divided in Intra and Inter tabs, to facilitate understanding, as you can see in (Figure 1).
- (NEW) XL Quantitation:
- This new module calculates the cross-linking quantitation using XIC (eXtracted Ion Chromatogram) approach. The user can access this module through the Utils menu, Quantitation (or pressing ALT + Q). (Figure 2)
- As you can see in the Figure 3, a new window will be opened and it'll necessary to select the directory where are the RAW files. After that, press the OK button. All process will be shown in the log box.
- When the process is finished, a new column is inserted in the Dynamic Report Results with the integration value. To open the quantitation, just double-clicking on the cell and a new window will show the XIC curve. (Figure 4)
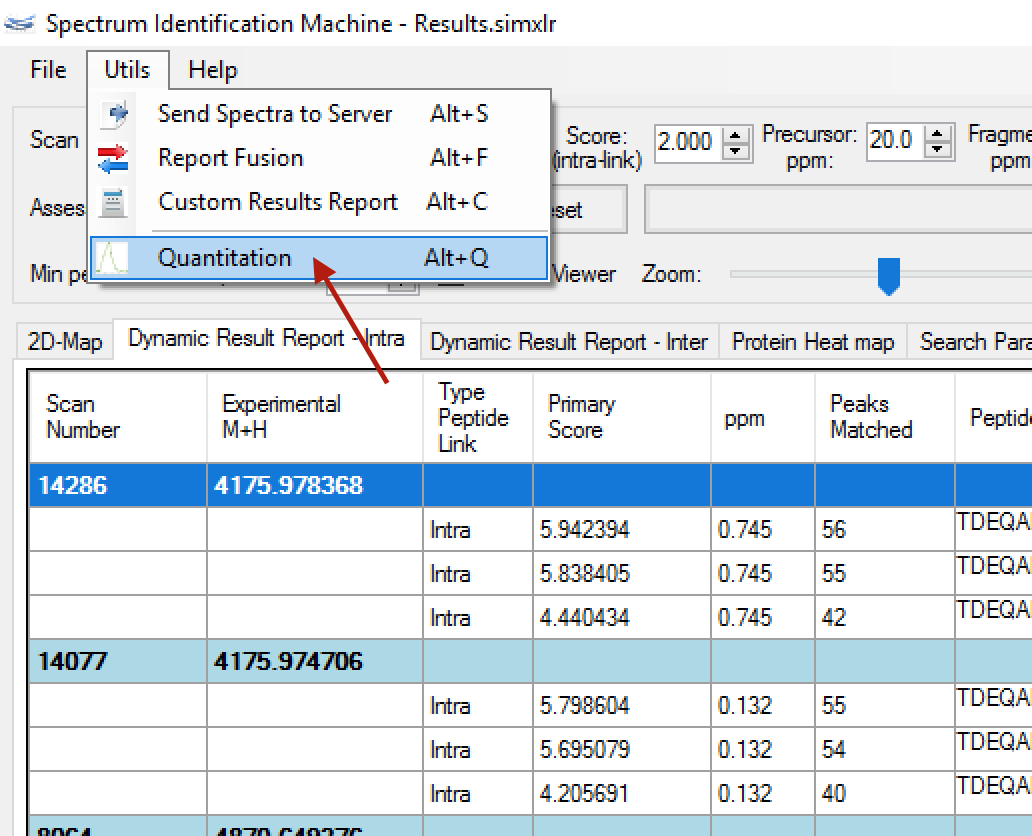
Figure 2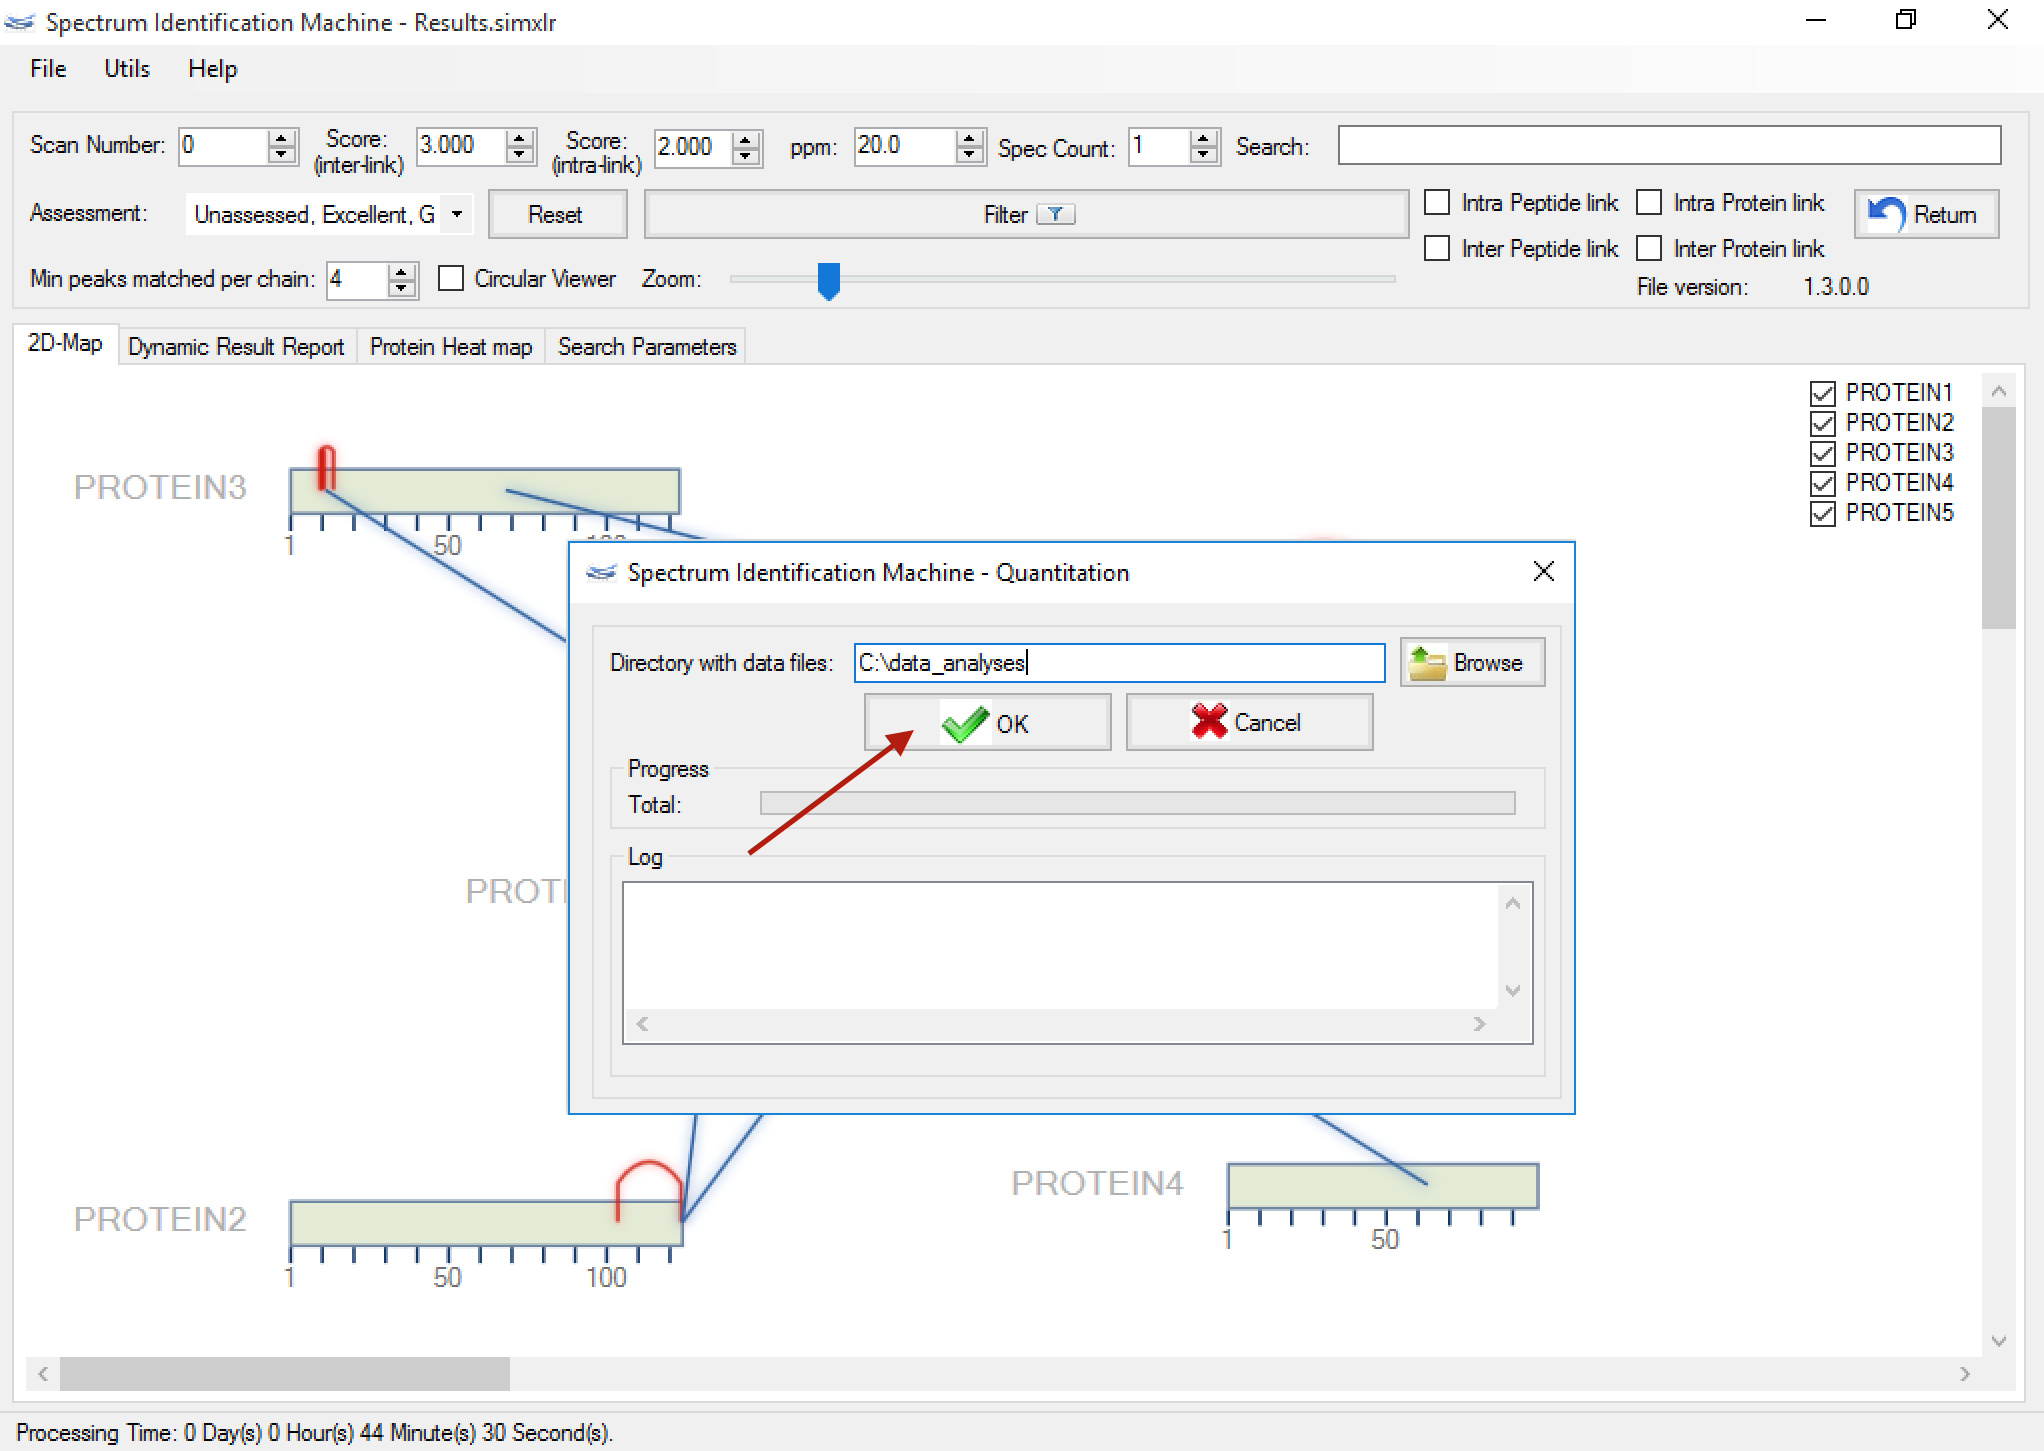
Figure 3
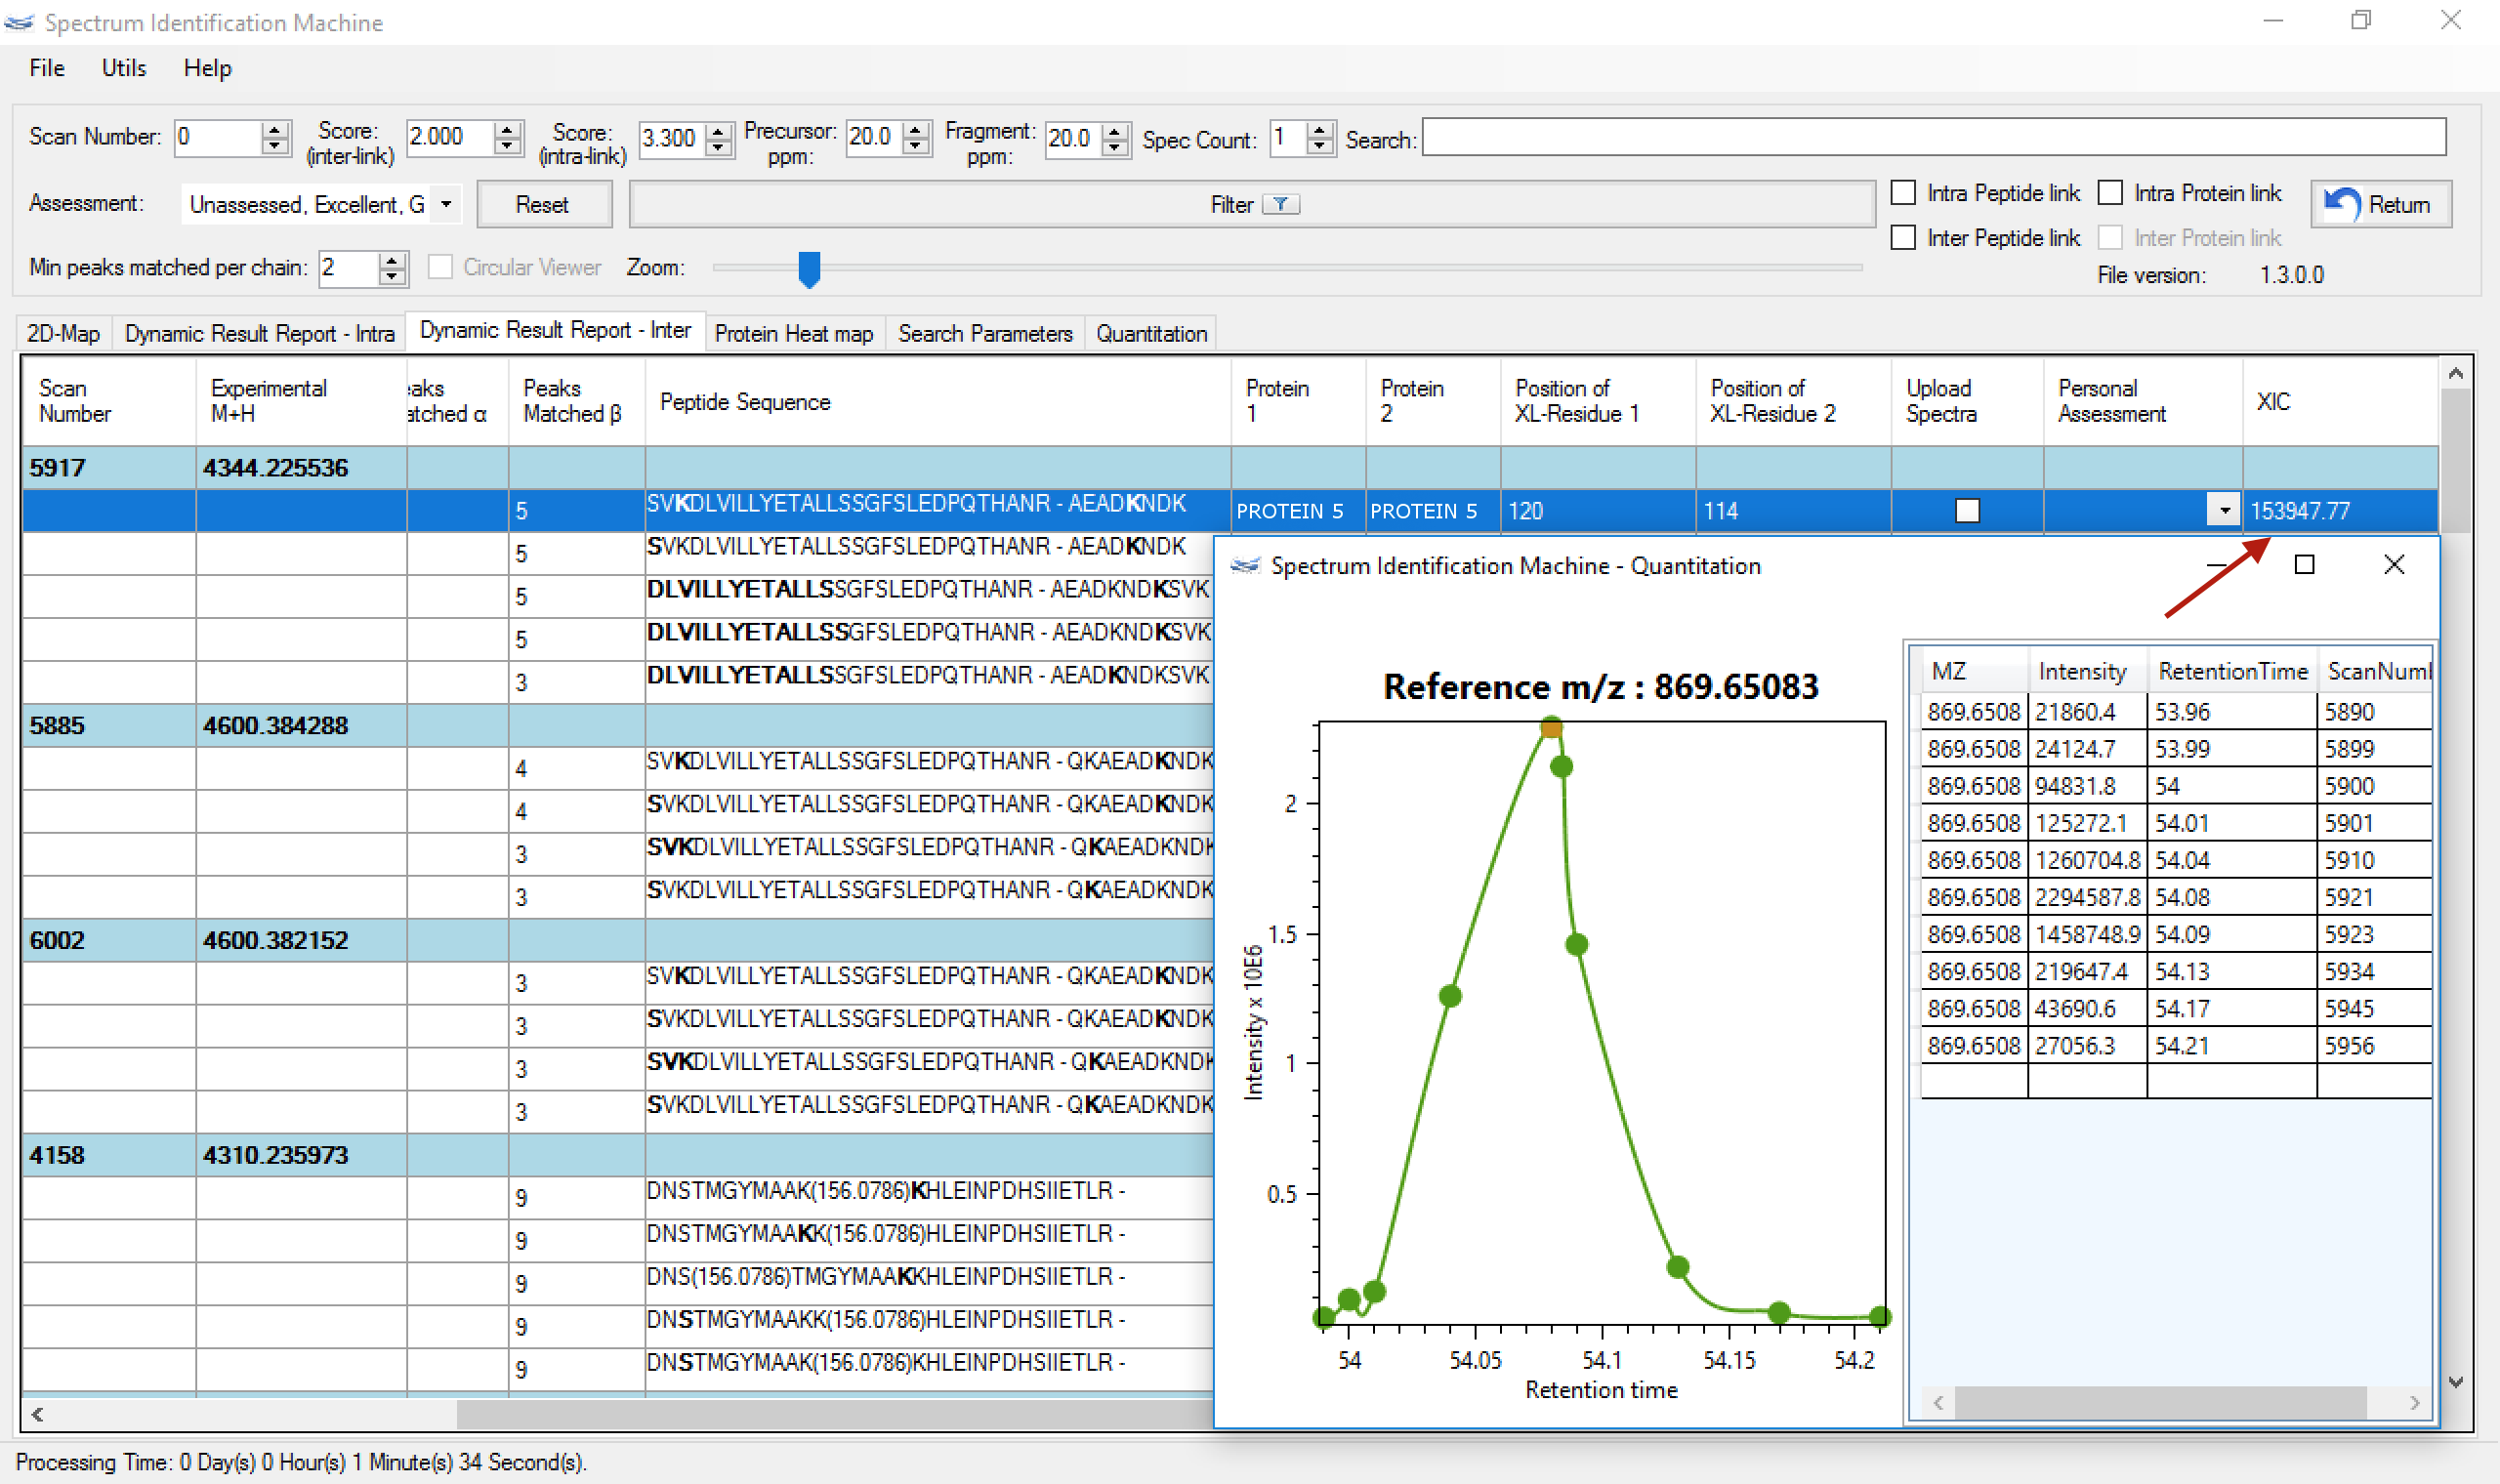
Figure 4 - Bug fixed to set up some homodimer parameters.
- Optimized the calculation of each molecule mass in homodimer search mode.
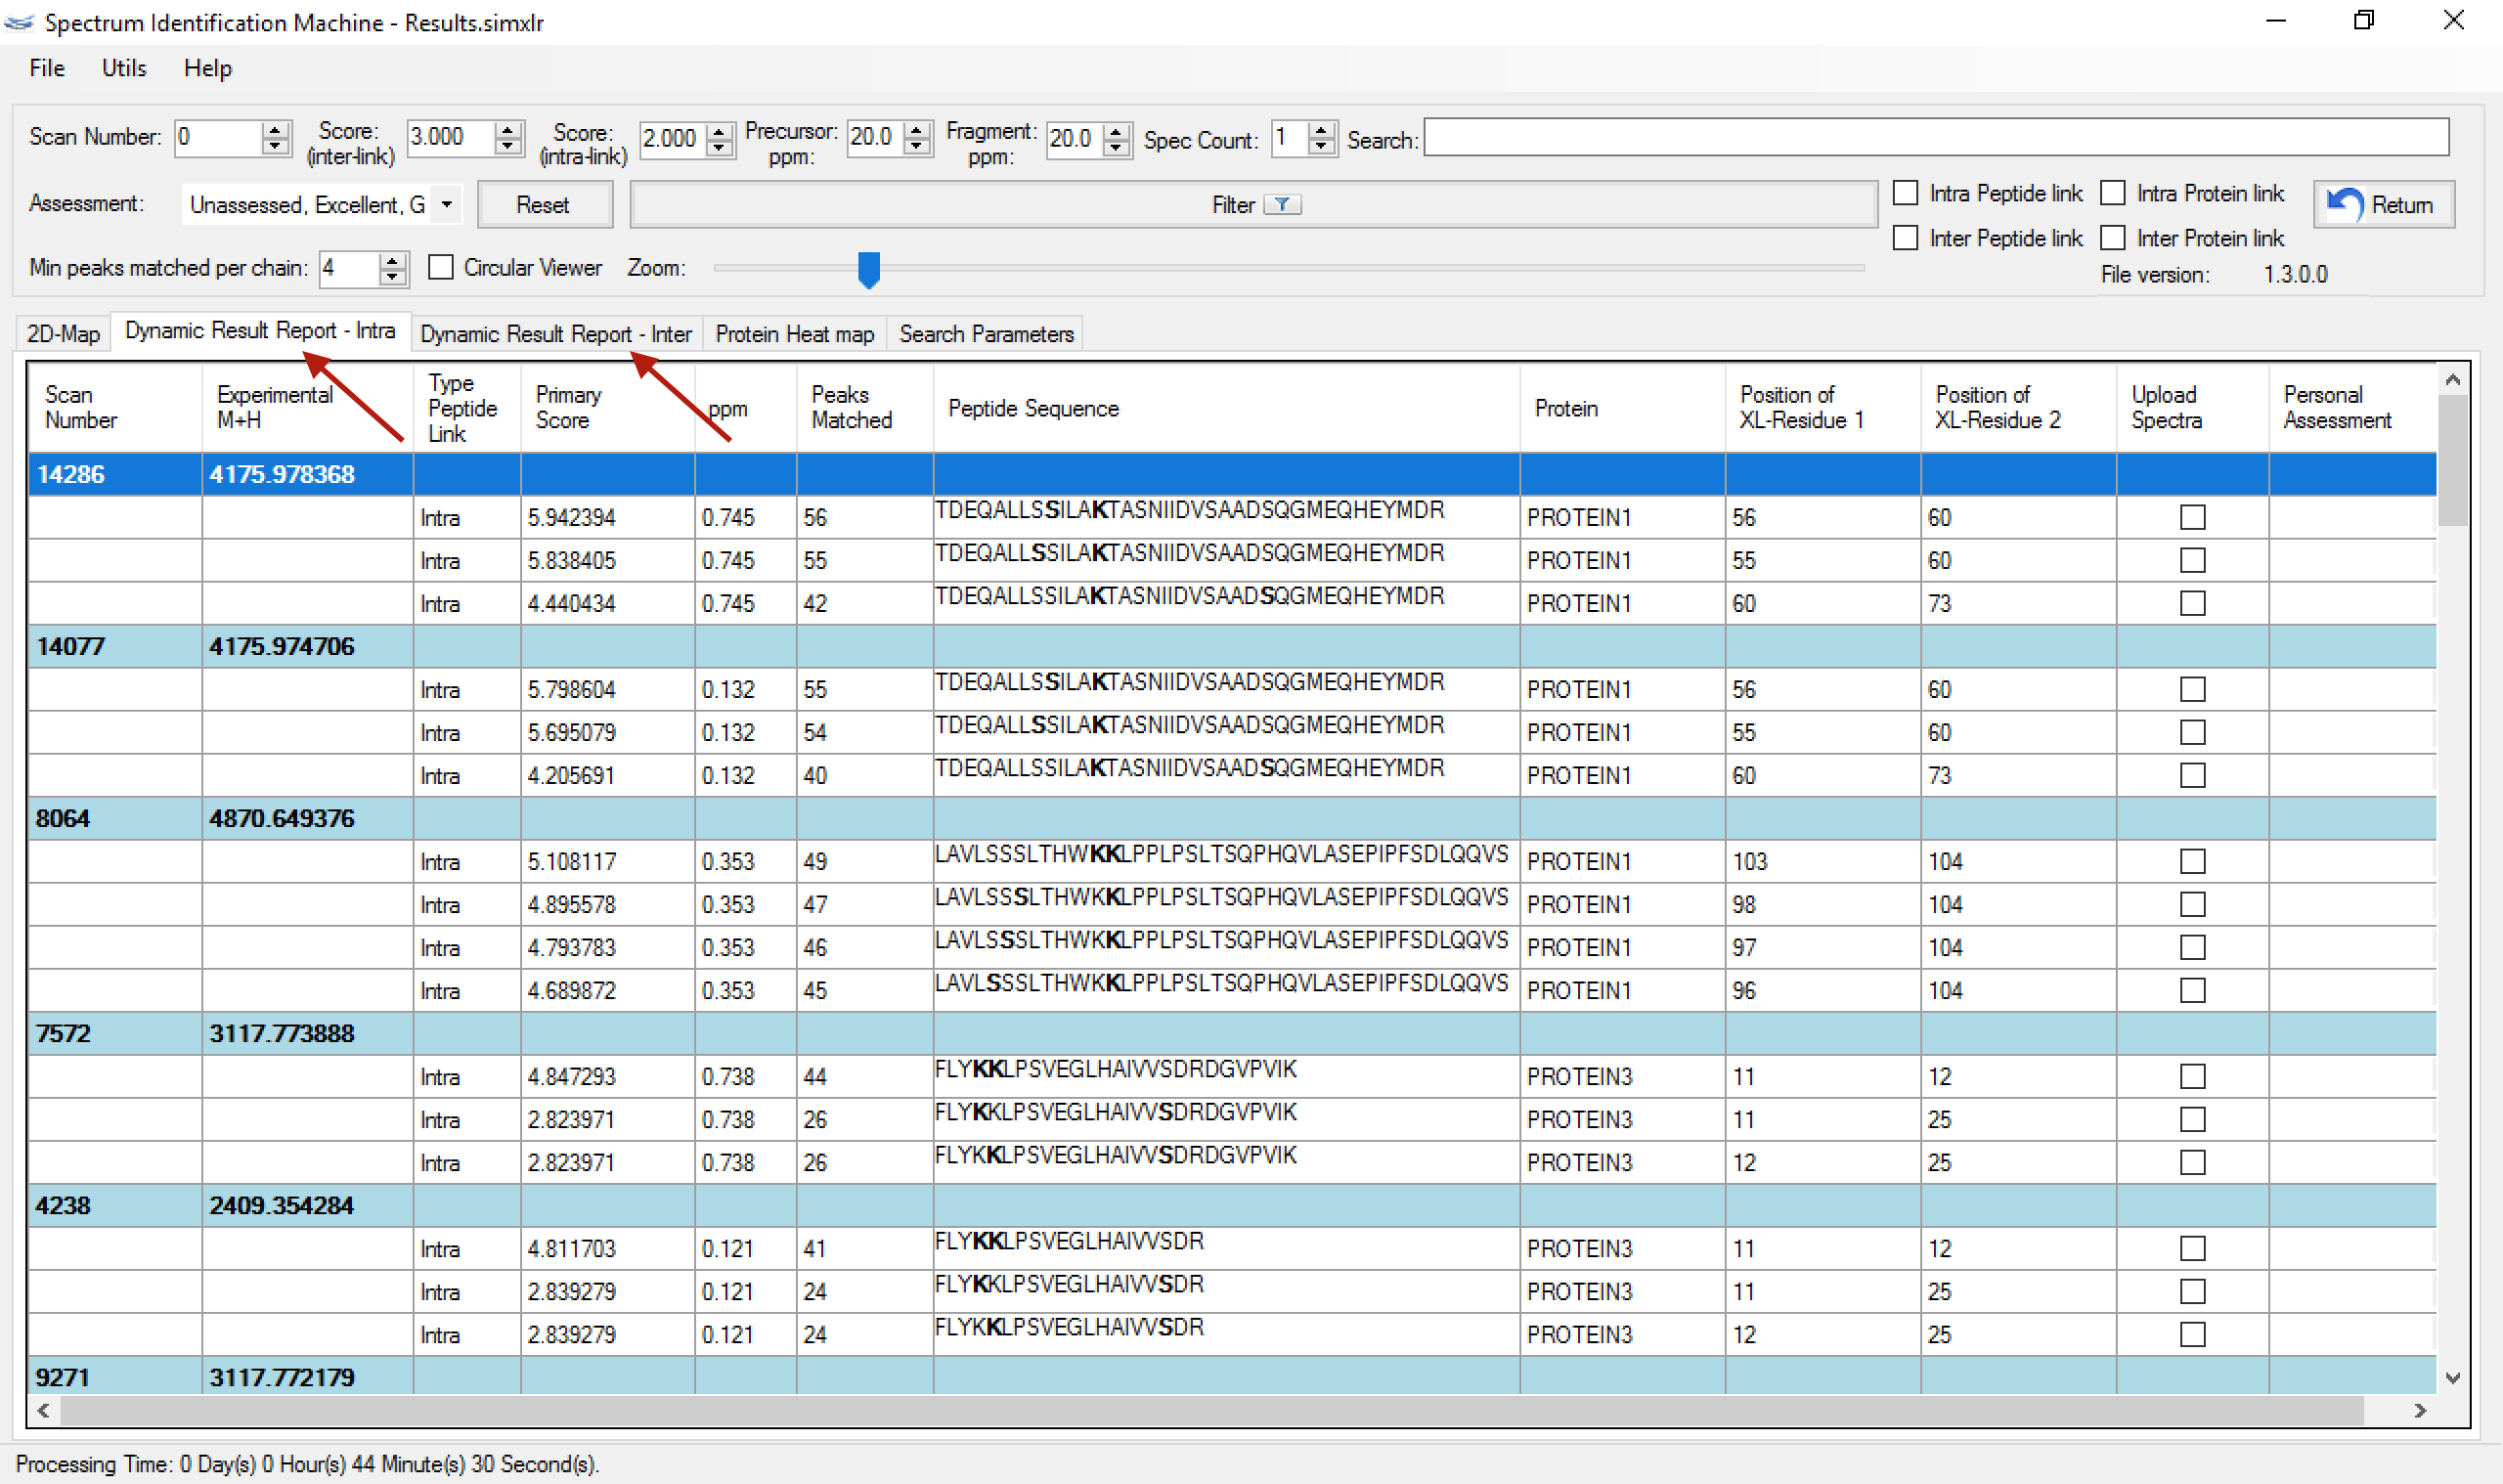
Figure 1
Version 1.2.X
Version 1.2.2.2
November 2nd, 2016
- Spectrum Viewer: Bug fixed for plotting any ion series. The error was happening when the user selected c or z alpha series to be plotted.
Version 1.2.2.1
July 11th, 2016
- XL Advanced Parameters: The user can select which fragmentation method was used in the experiment. HCD is default as can seen in Figure 1. A custom fragmentation method can be selected. In this case, it's necessary to select which series will be in the theoretical spectrum.
The Log box will show all steps according to search progress. The background black box was hidden.
The user can export all logs through File menu → Export log. - Bug fixed when a new spectrum is loaded on Spectrum Viewer.
- Bug fixed in core machine to perform a optimized search.
- Bug fixed when a residue modification was inserted (homodimer analysis).
- Bug fixed when a N/C-terminus PTM was inserted.
- Bug fixed in fusion results.
- Bug fixed in main interface - sequence database field.
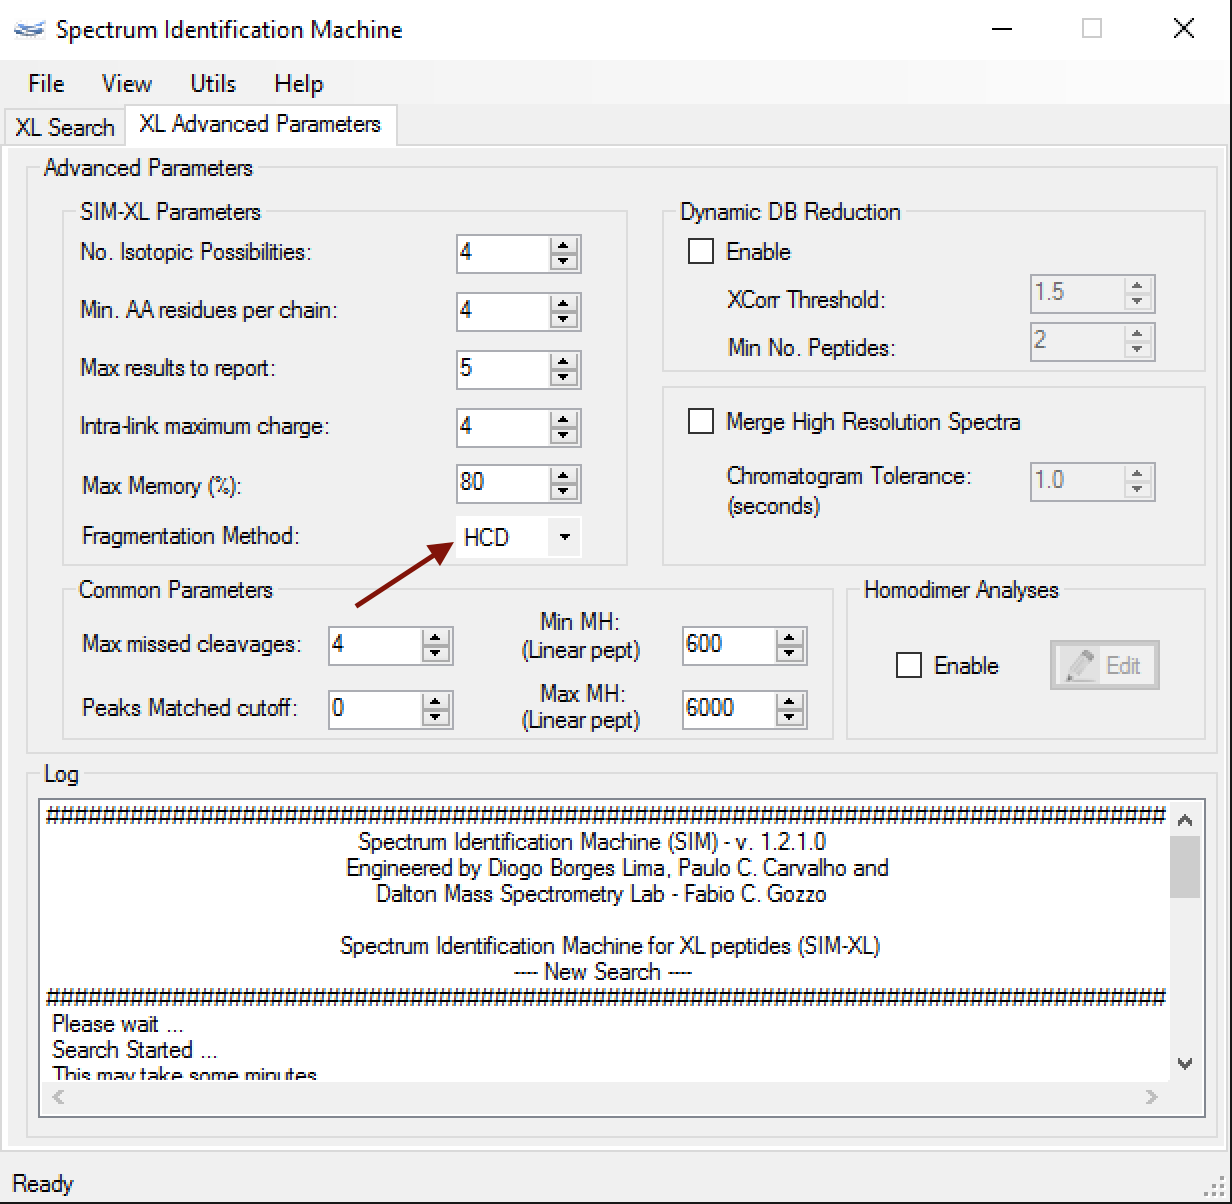
Figure 1
Version 1.2.0.3
March 24th, 2016
- Spectrum Viewer: The Peptide Annotation contains the numbered series annotated, as can be seen in Figure 1.
- Results Browser:
- Bug fixed when it was opened a wrong spectrum to be visualized.
- Bug fixed when the user applied an assessment for a specific spectrum.
- PyMOL script:
- Added a new column about the protein sequence shift. Now the user can put an offset to shift the identified cross-linkers, as you can see in Figure 2.
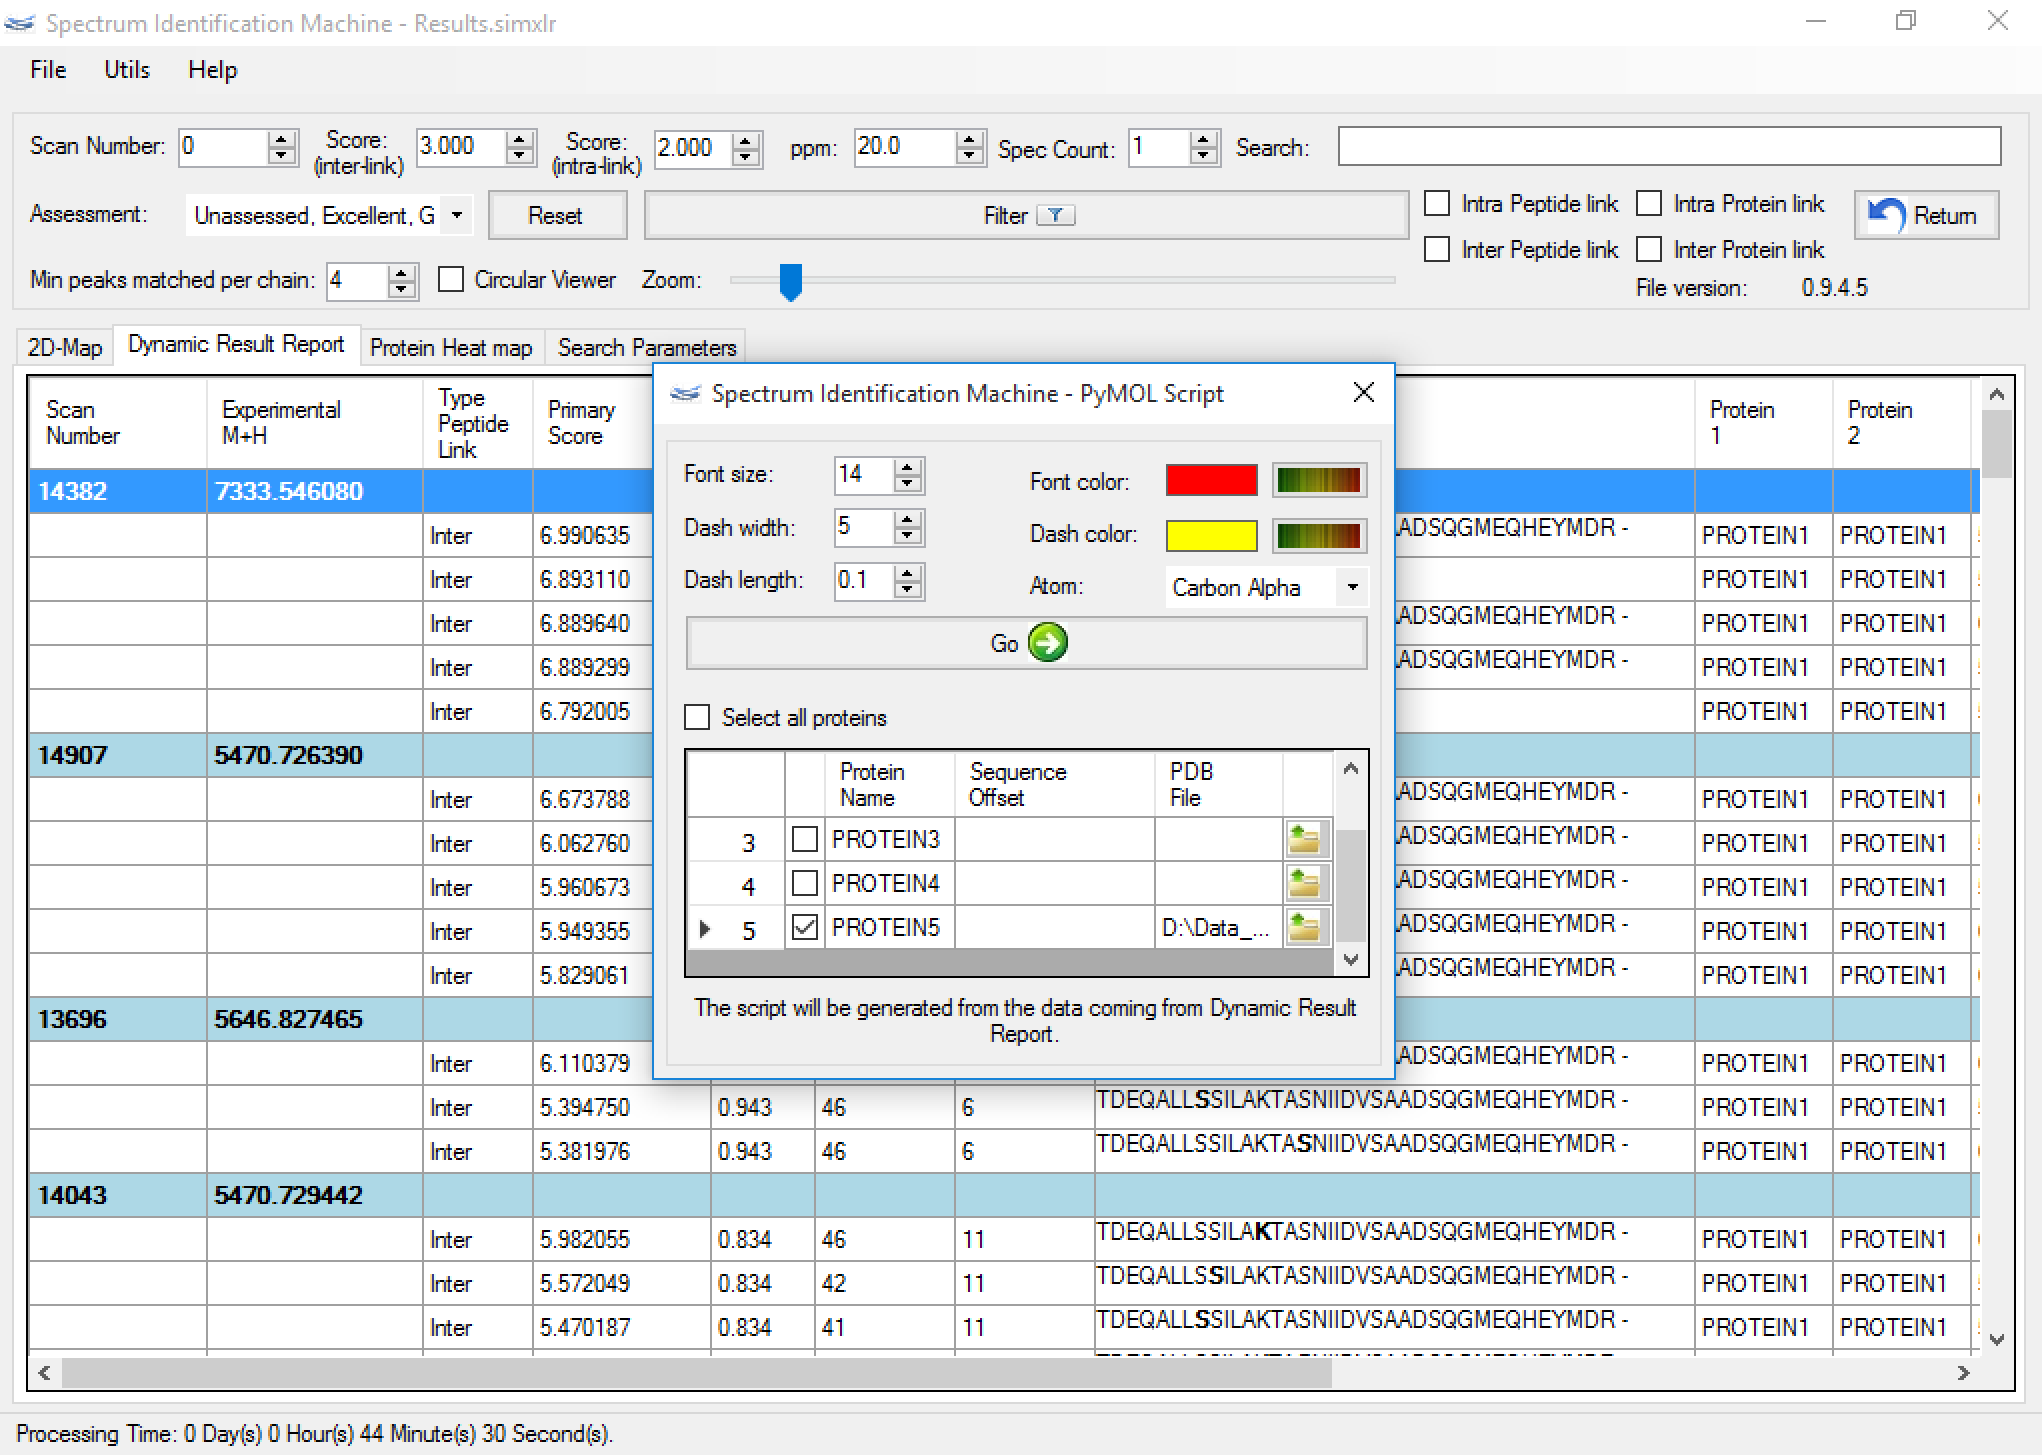
Figure 2 - Search engine:
- Optimized and bug fixed.
- The user can set up the maximum percentage memory that SIM-XL will use to perform the search.
- File Converter: Optimized algorithm to converter files.
- (NEW) Homodimer analysis:
- SIM-XL enables to perform a search with isotopically labeled proteins allowing for identification homodimers. For this, firstly the user needs to select which proteins will be isotopically labeled by clicking on 'Edit' button in Homodimer analyses, as you can see in Figure 3.
- After that, a new window will be opened. So, the user can choose the proteins that will be isotopically labeled by atom or residue, as you can see in Figure 4.
- Figure 5 shows a result containing two proteins: the first one in the original version, and the second one isotopically labeled with nitrogen 15 (or 15N). The user can visualize the spectrum through the Spectrum Viewer, and can change the kind of peptide (marking it or clearing it) dynamically, as you can see in Figure 6.
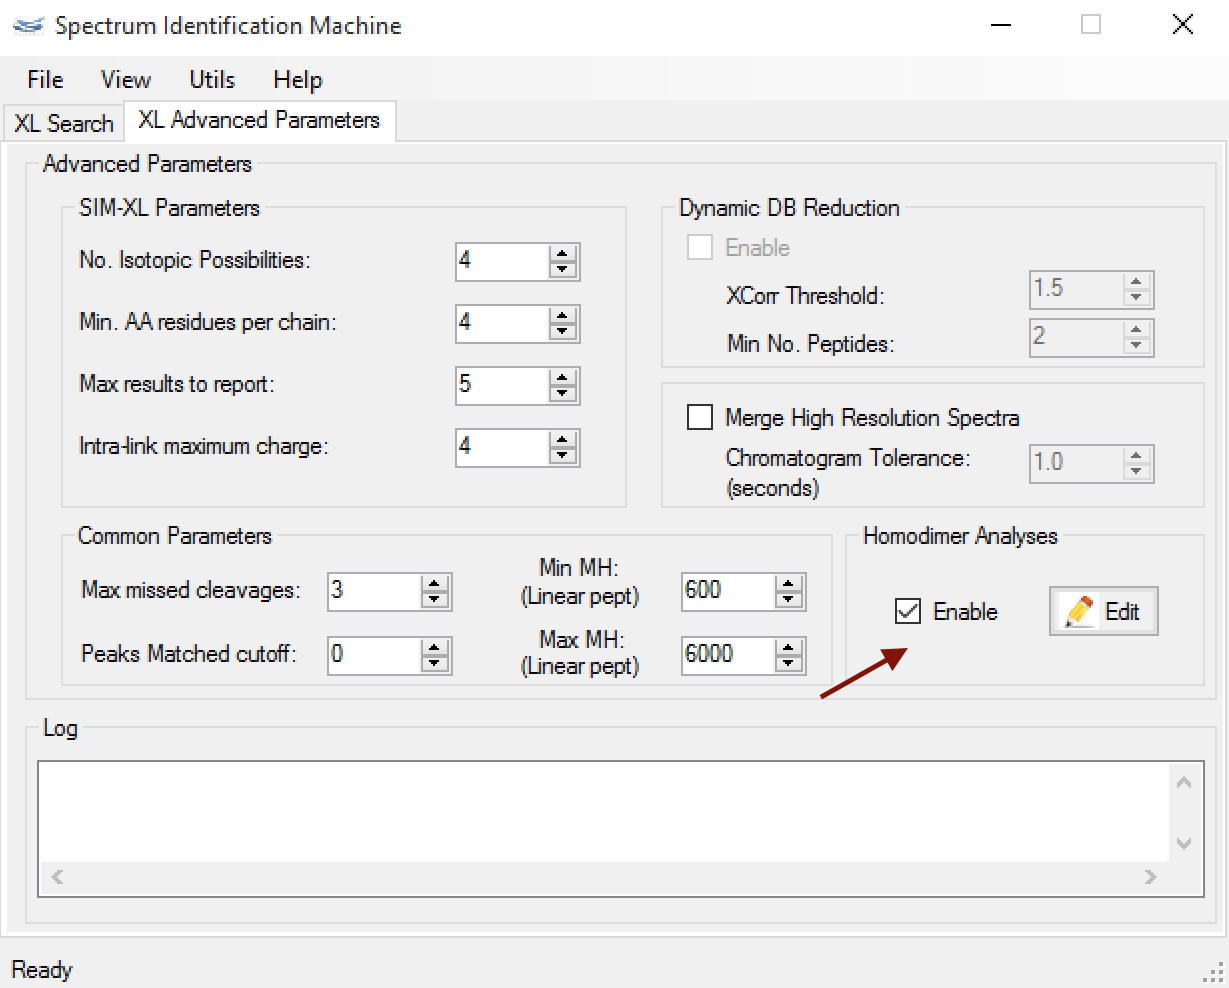
Figure 3
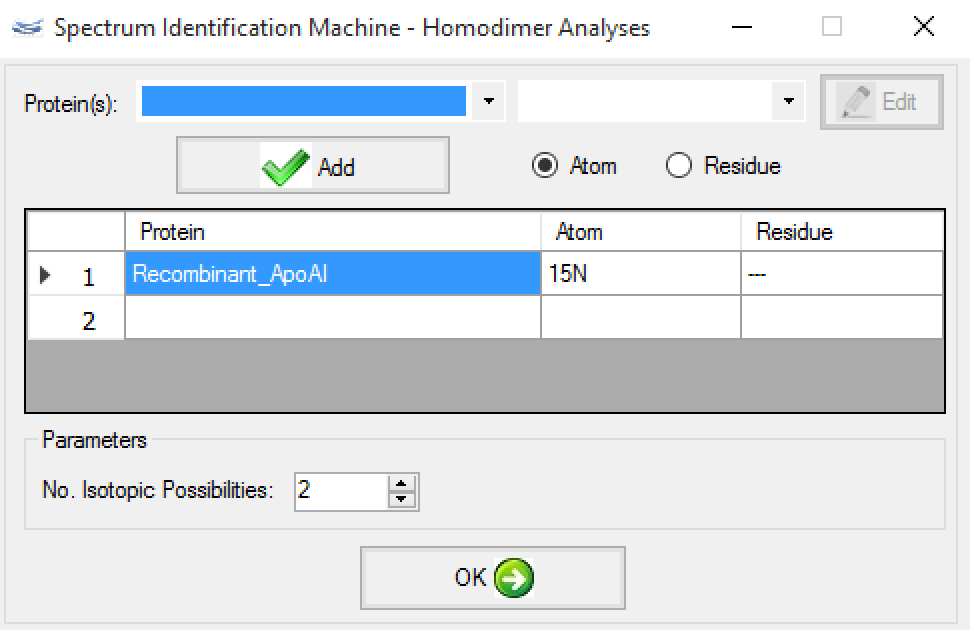
Figure 4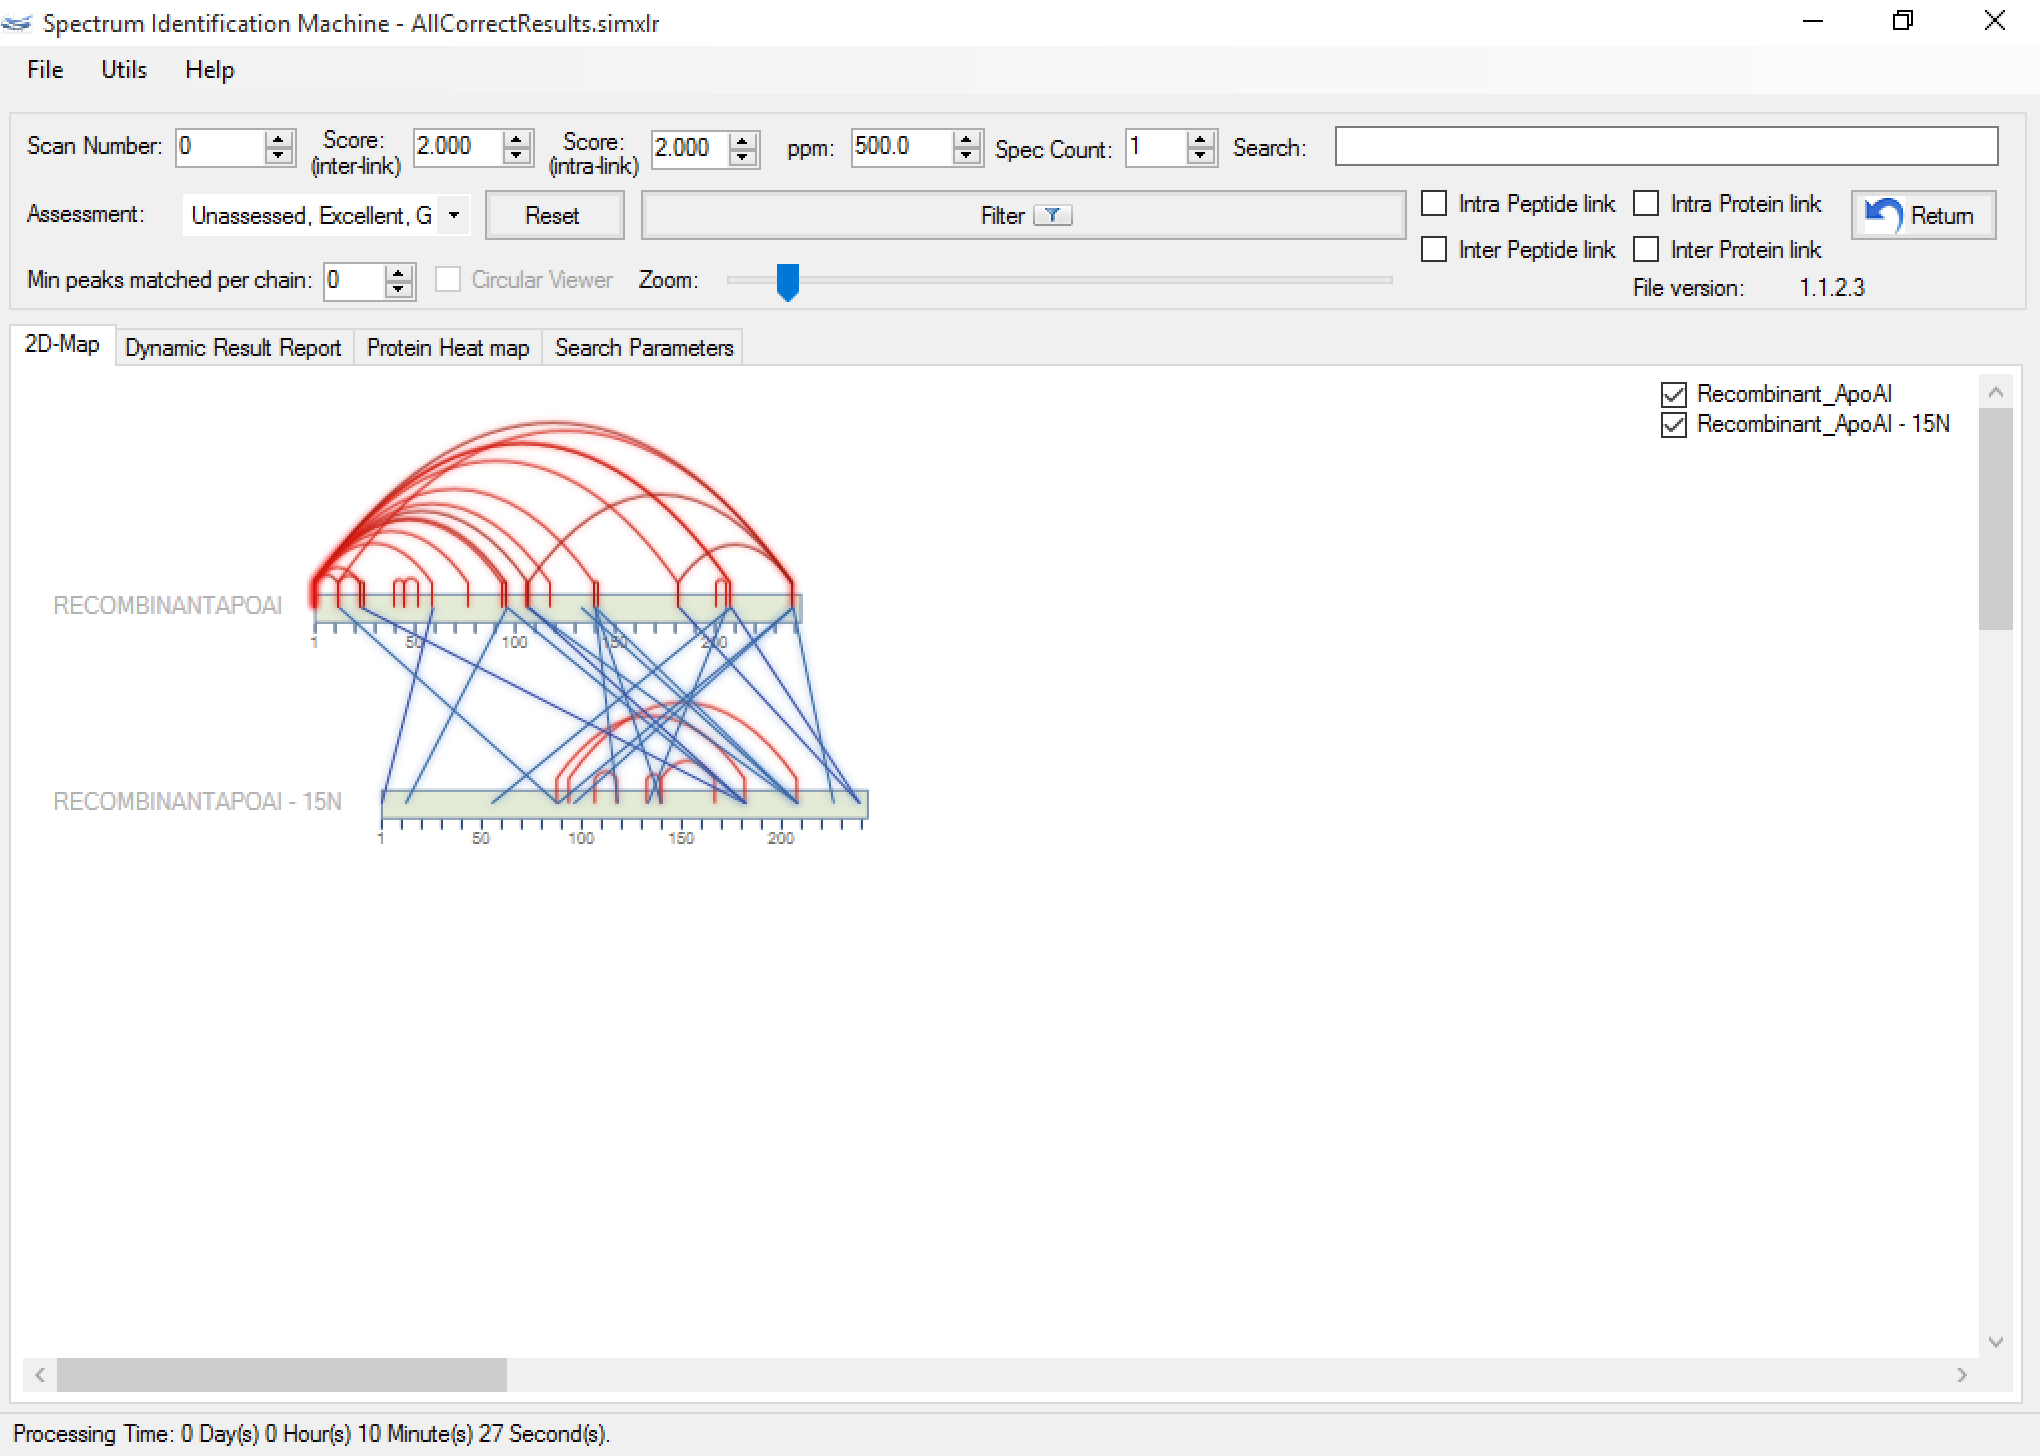
Figure 5
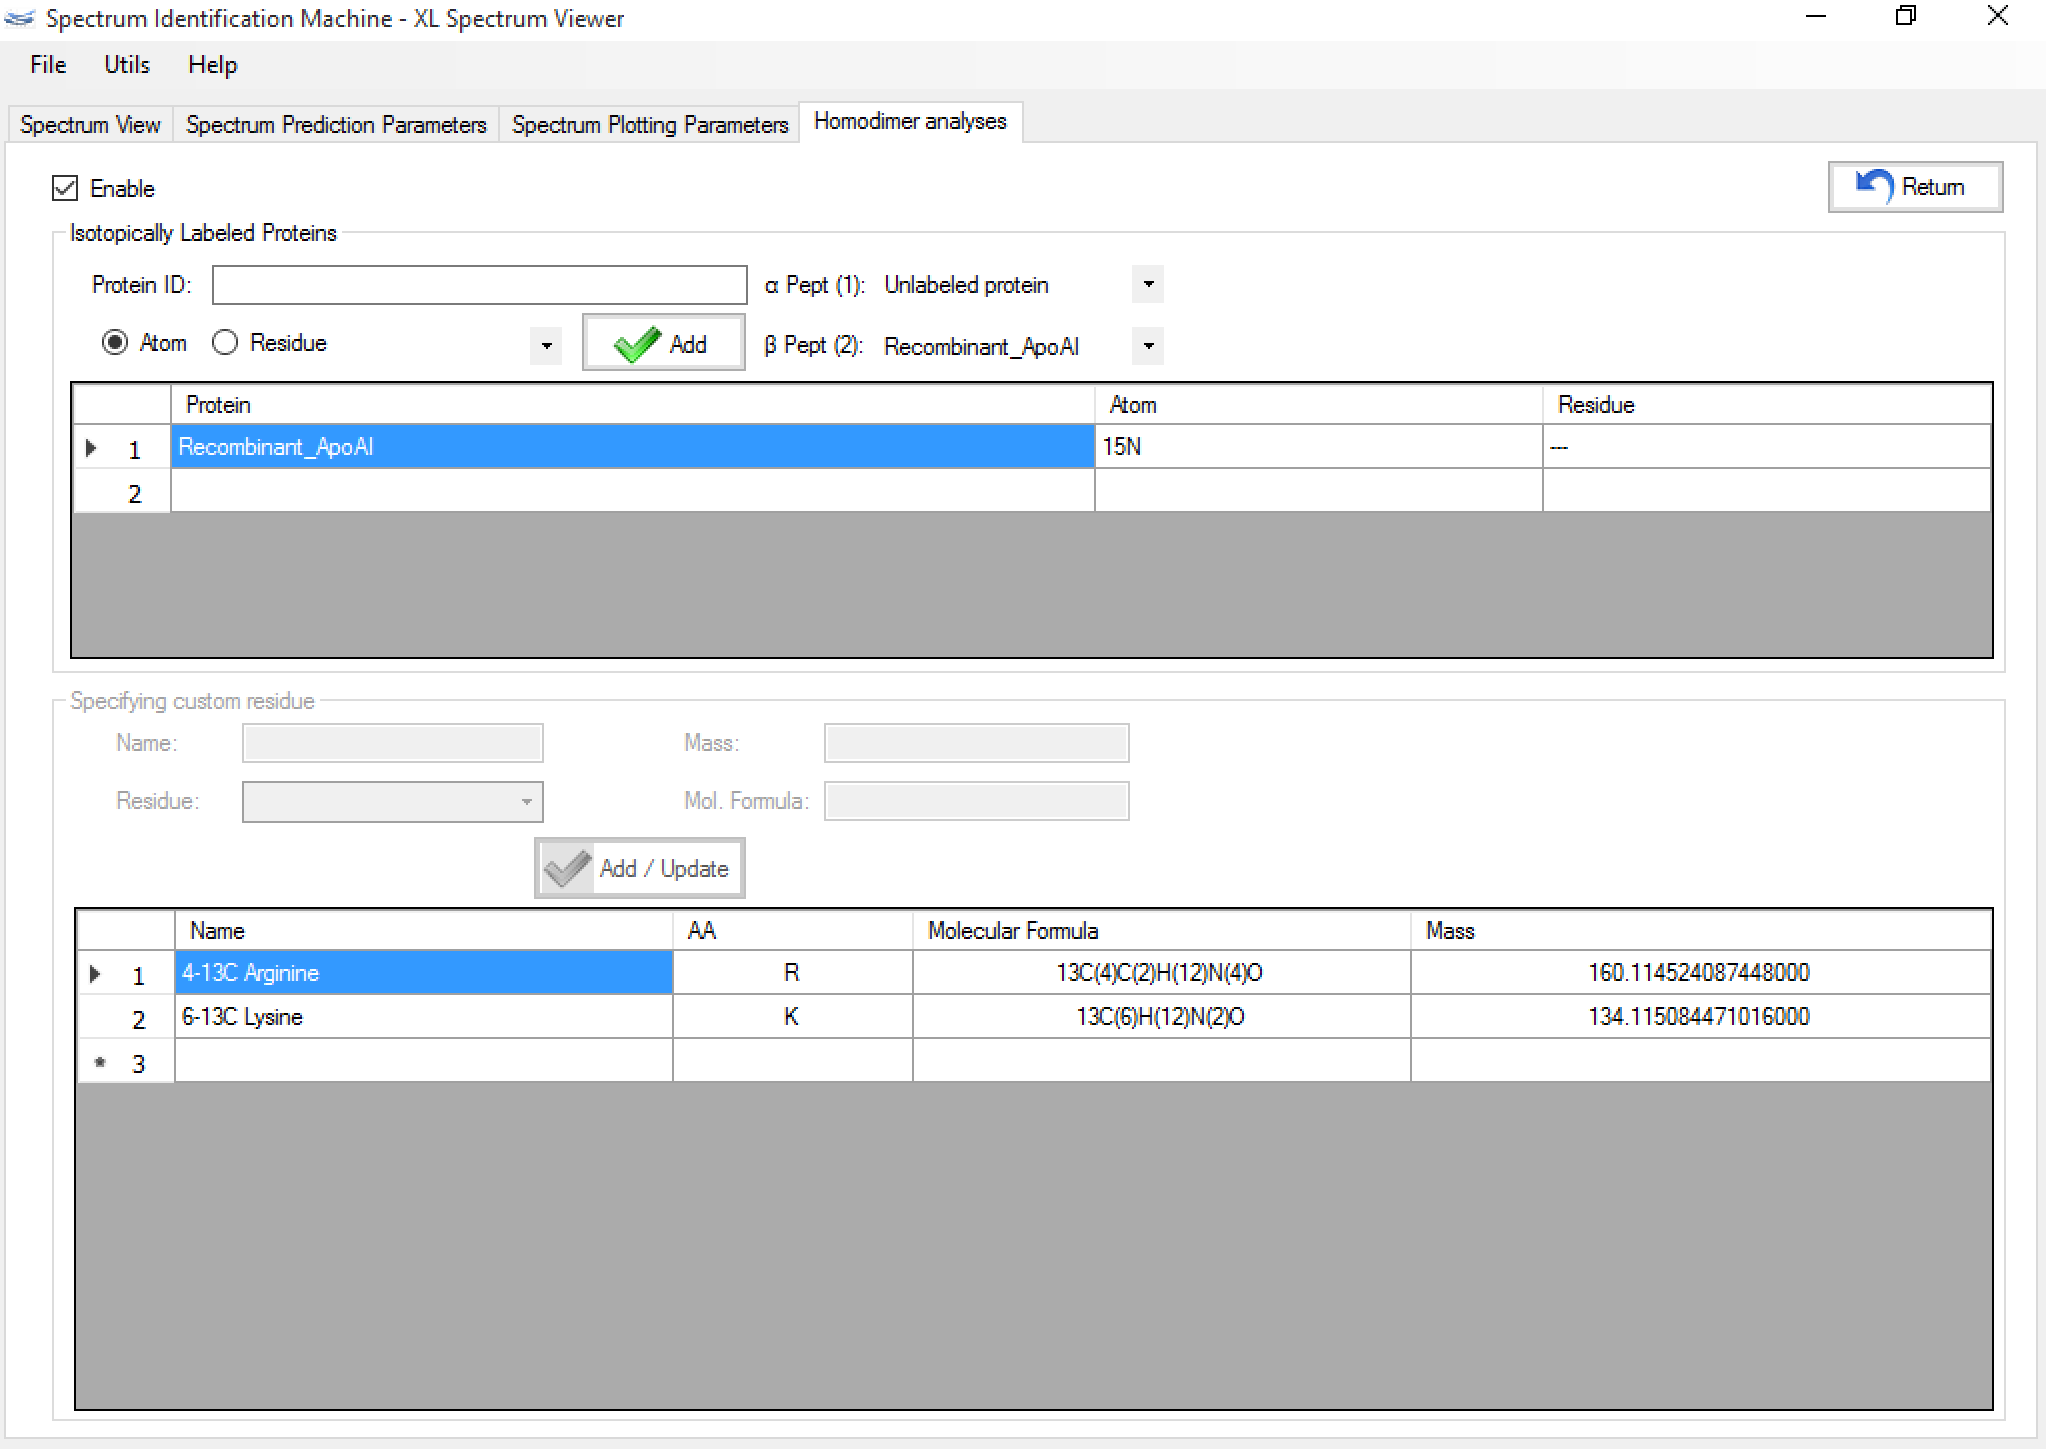
Figure 6
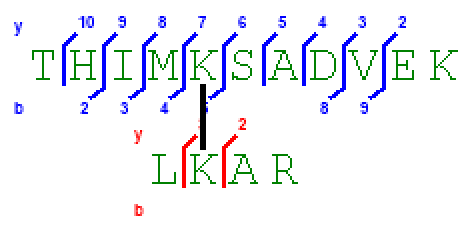
Figure 1
Version 1.1.X
Version 1.1.2.2
Jan 8th, 2016
- Results Browser:
- Search Parameters: New tab in results browser which shows all parameters used during the search. If two or more SIM-XL results are loaded, the parameters of the last results will be displayed.
- By clicking on File menu → Export Results → SIM-XL Params (or pressing CTRL + SHIFT + S) is possible to export SIM-XL params file.
- All identified spectra can be exported by clicking on File menu → Export Results → MS2 - identified spectra (or pressing ALT + M).
- The identified proteins can also be exported by clicking on File menu → Export Results → Fasta - identified proteins (or pressing ALT + A).
- Bug fixed when the user selected a modification that reacted with two or more residues.
- Bug fixed when the user selected an enzyme which reacts in N-term.
Version 1.1.1.0
Dec 7th, 2015
- File Converter: Bug fixed when converting to MS3 file.
- Results Browser:
- Bug fixed when a spectrum is loaded.
- Heat Map: The user can open a specific spectrum by clicking on cell and selecting a candidate. (Figure 1)
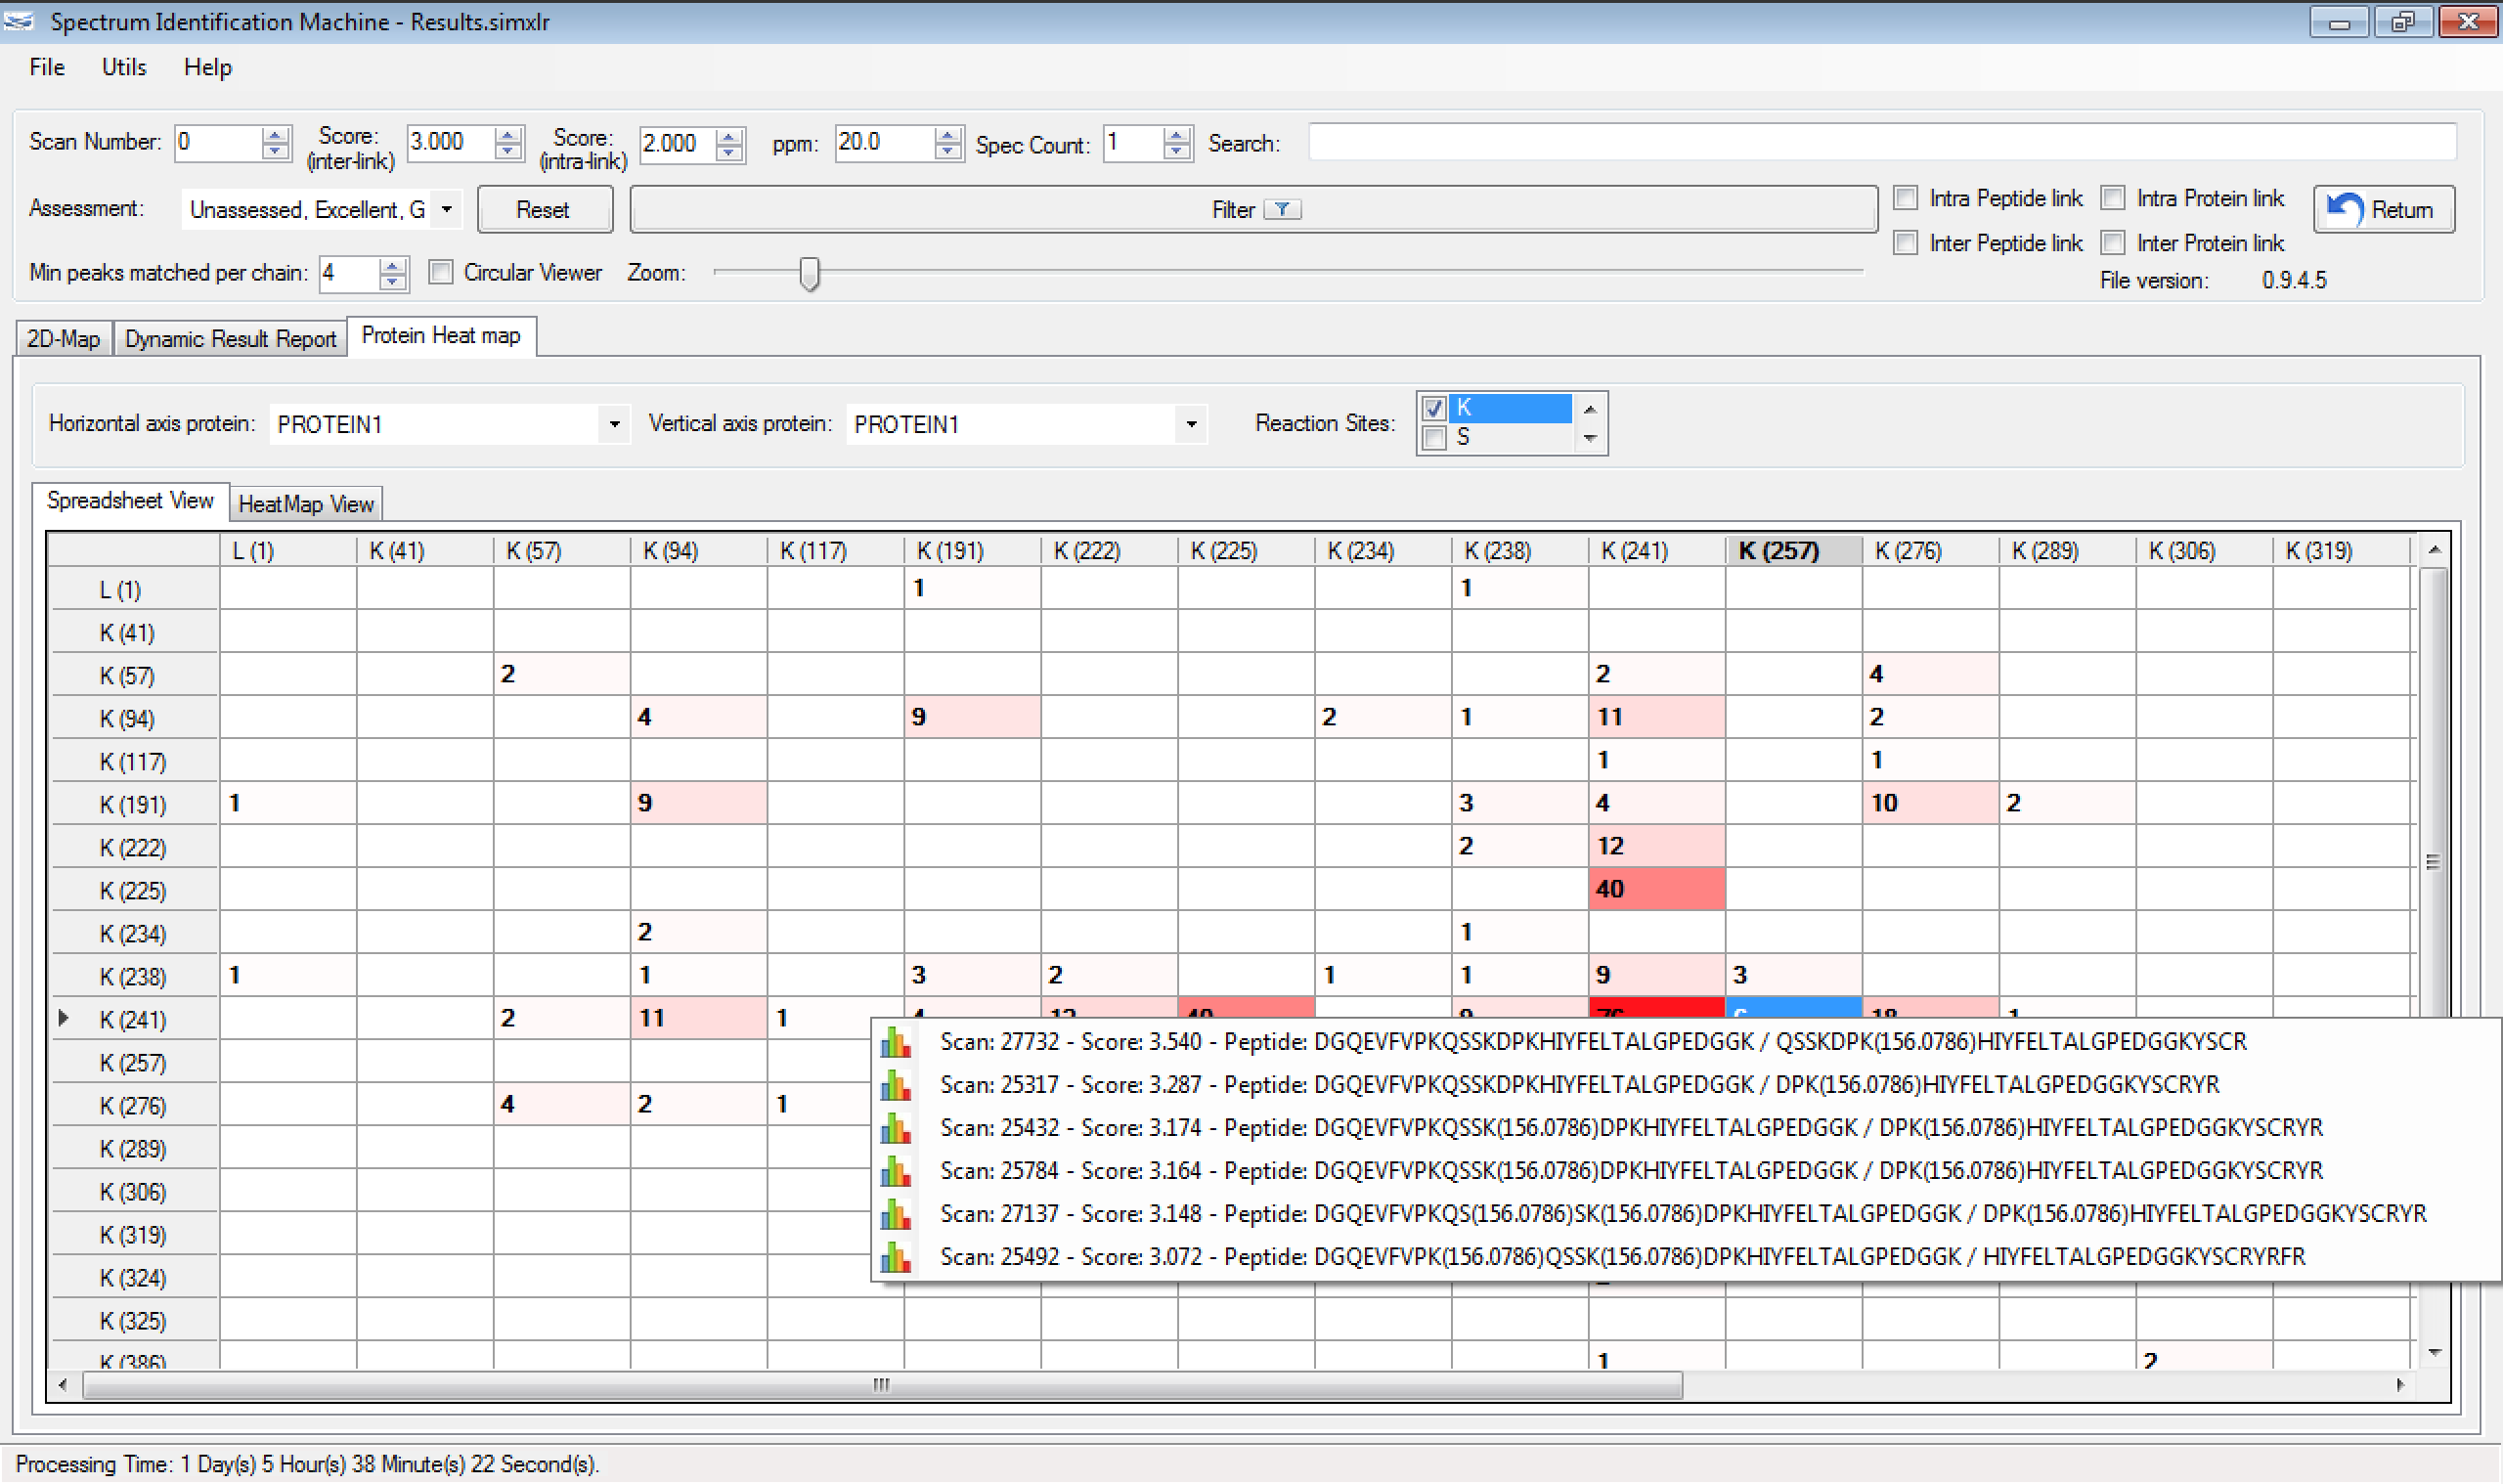
Figure 1 - Load file: The user can open more than one *.simxlr file.
- Spectrum Viewer: RANSAC is calculated selecting the top 10 spectra for each raw file, and reflected for all other candidates. This way, all identified spectra for each file will show the same linear regression.
Version 1.1.0.0
Oct 28th, 2015
- Optimized search.
- File Converter: Optimized the generation file.
- Residue Library: Fixed the addition of new residue.
- Results Browser:
- Score: There are two different fields for filtering the results → For intralink and interlink, where the initial values are 2.0 and 2.5 respectively.
- (NEW) Circular viewer: If there are more than two proteins identified, this field is enabled (Figure 1). Each protein can be dragged and dropped on canvas, and can be changed to bar viewer (by right-clicking on protein) for obtaining a better visualization (Figure 2). The intralinks are represented by red lines and the interlinks by blue lines. If a link (a spectrum) is evaluated, it will be showed darker. The user can highlight two specific proteins to see all interactions between them, by double-clicking on the first one, and after, double-clicking on the second protein. To unselect, just double-click on another protein (Figure 3).
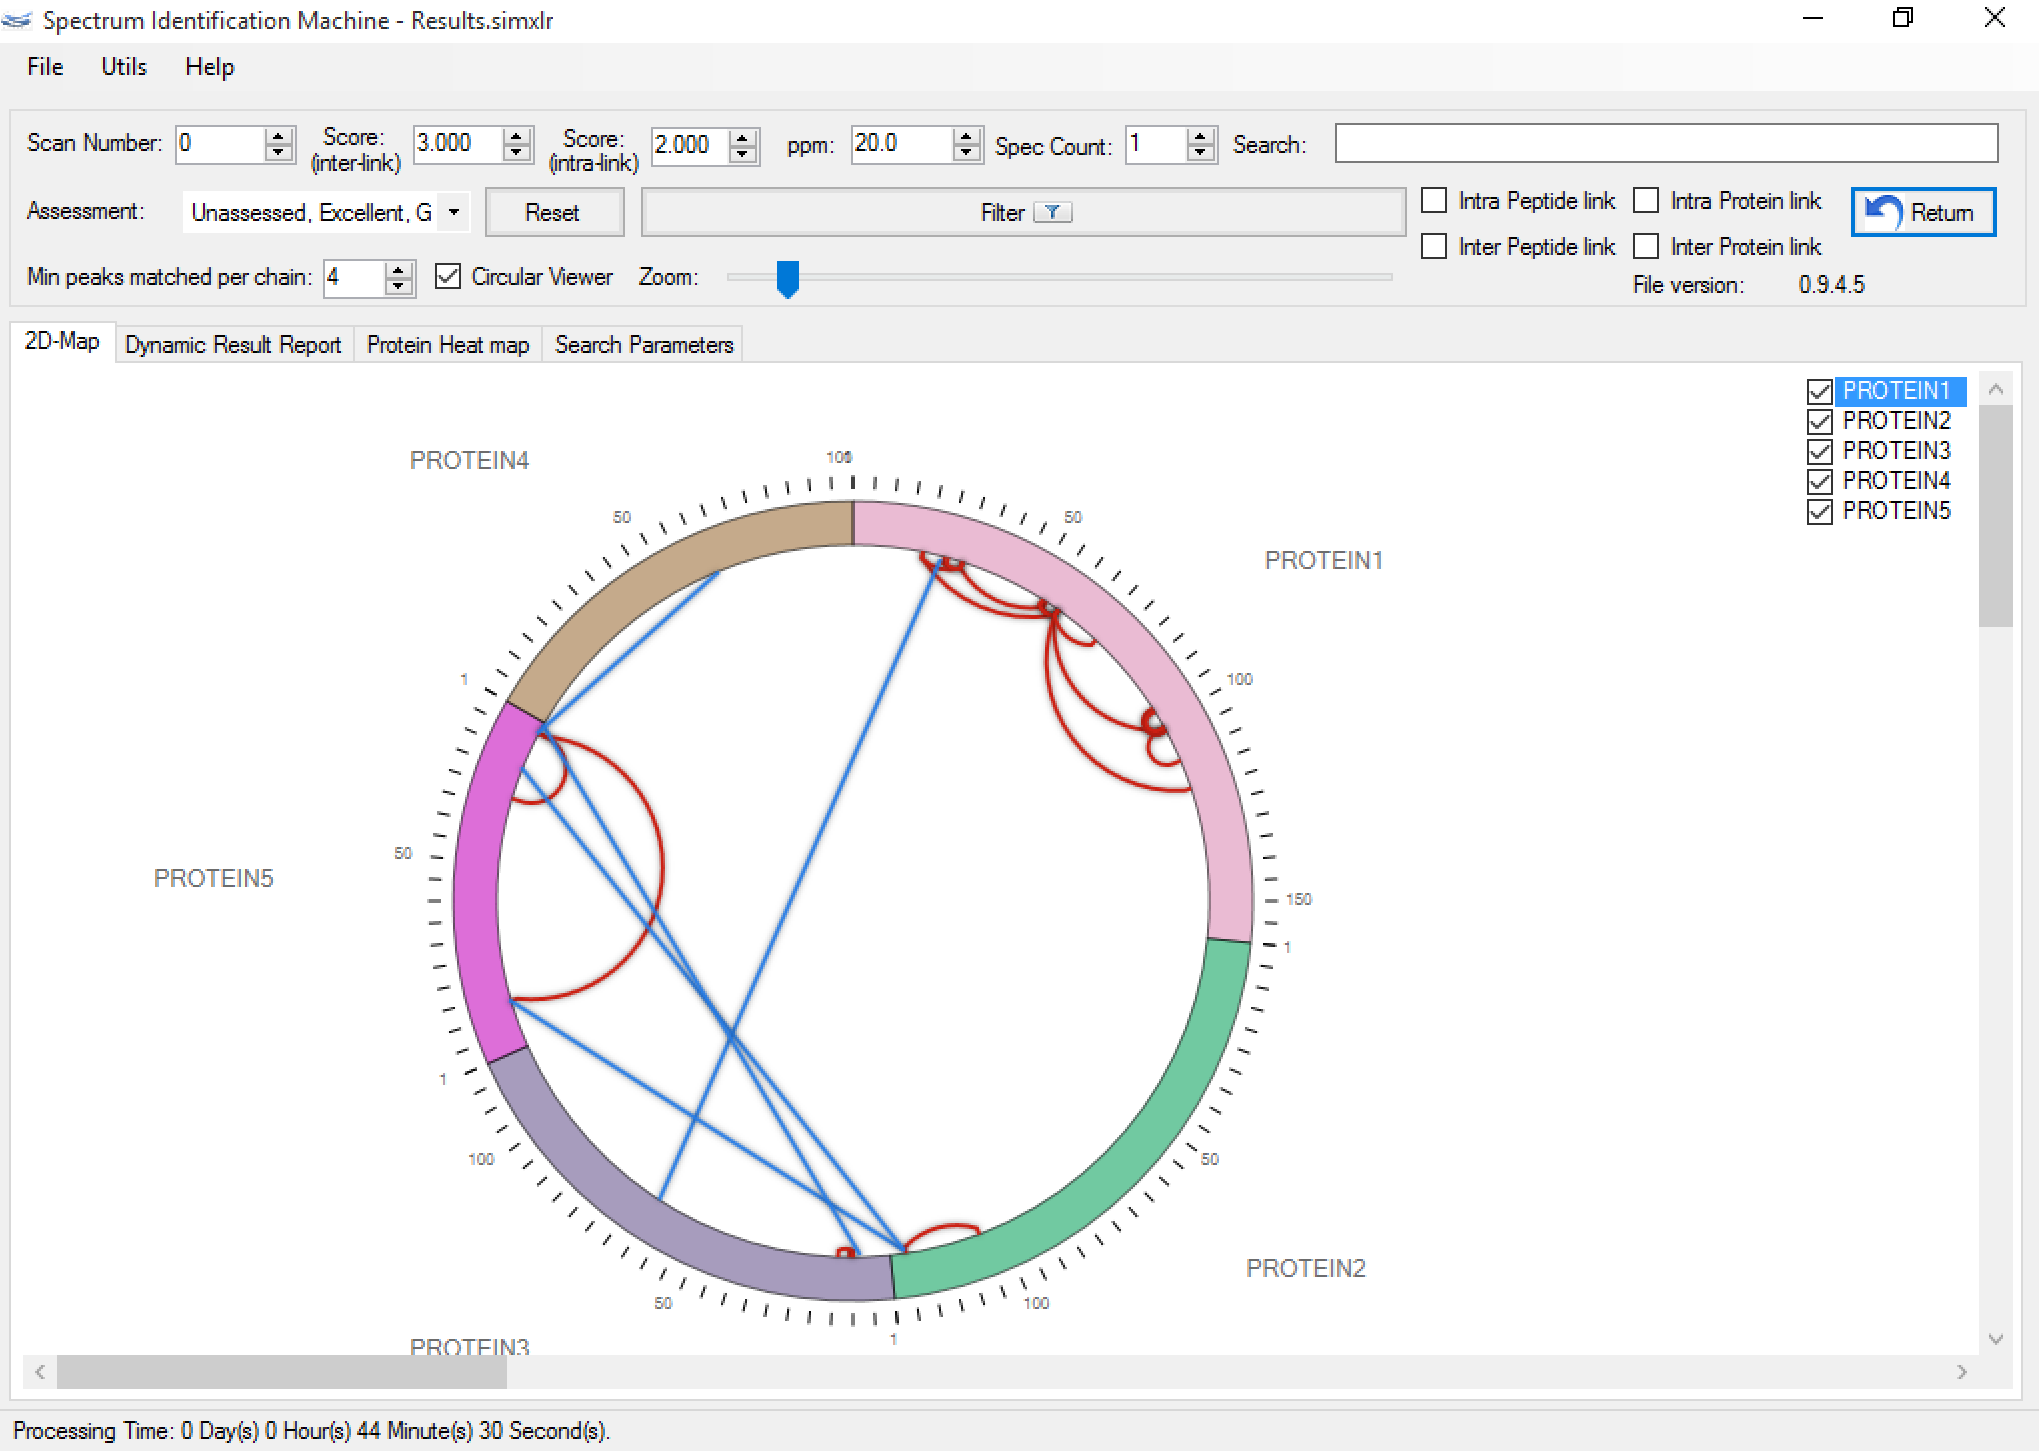
Figure 1
Figure 2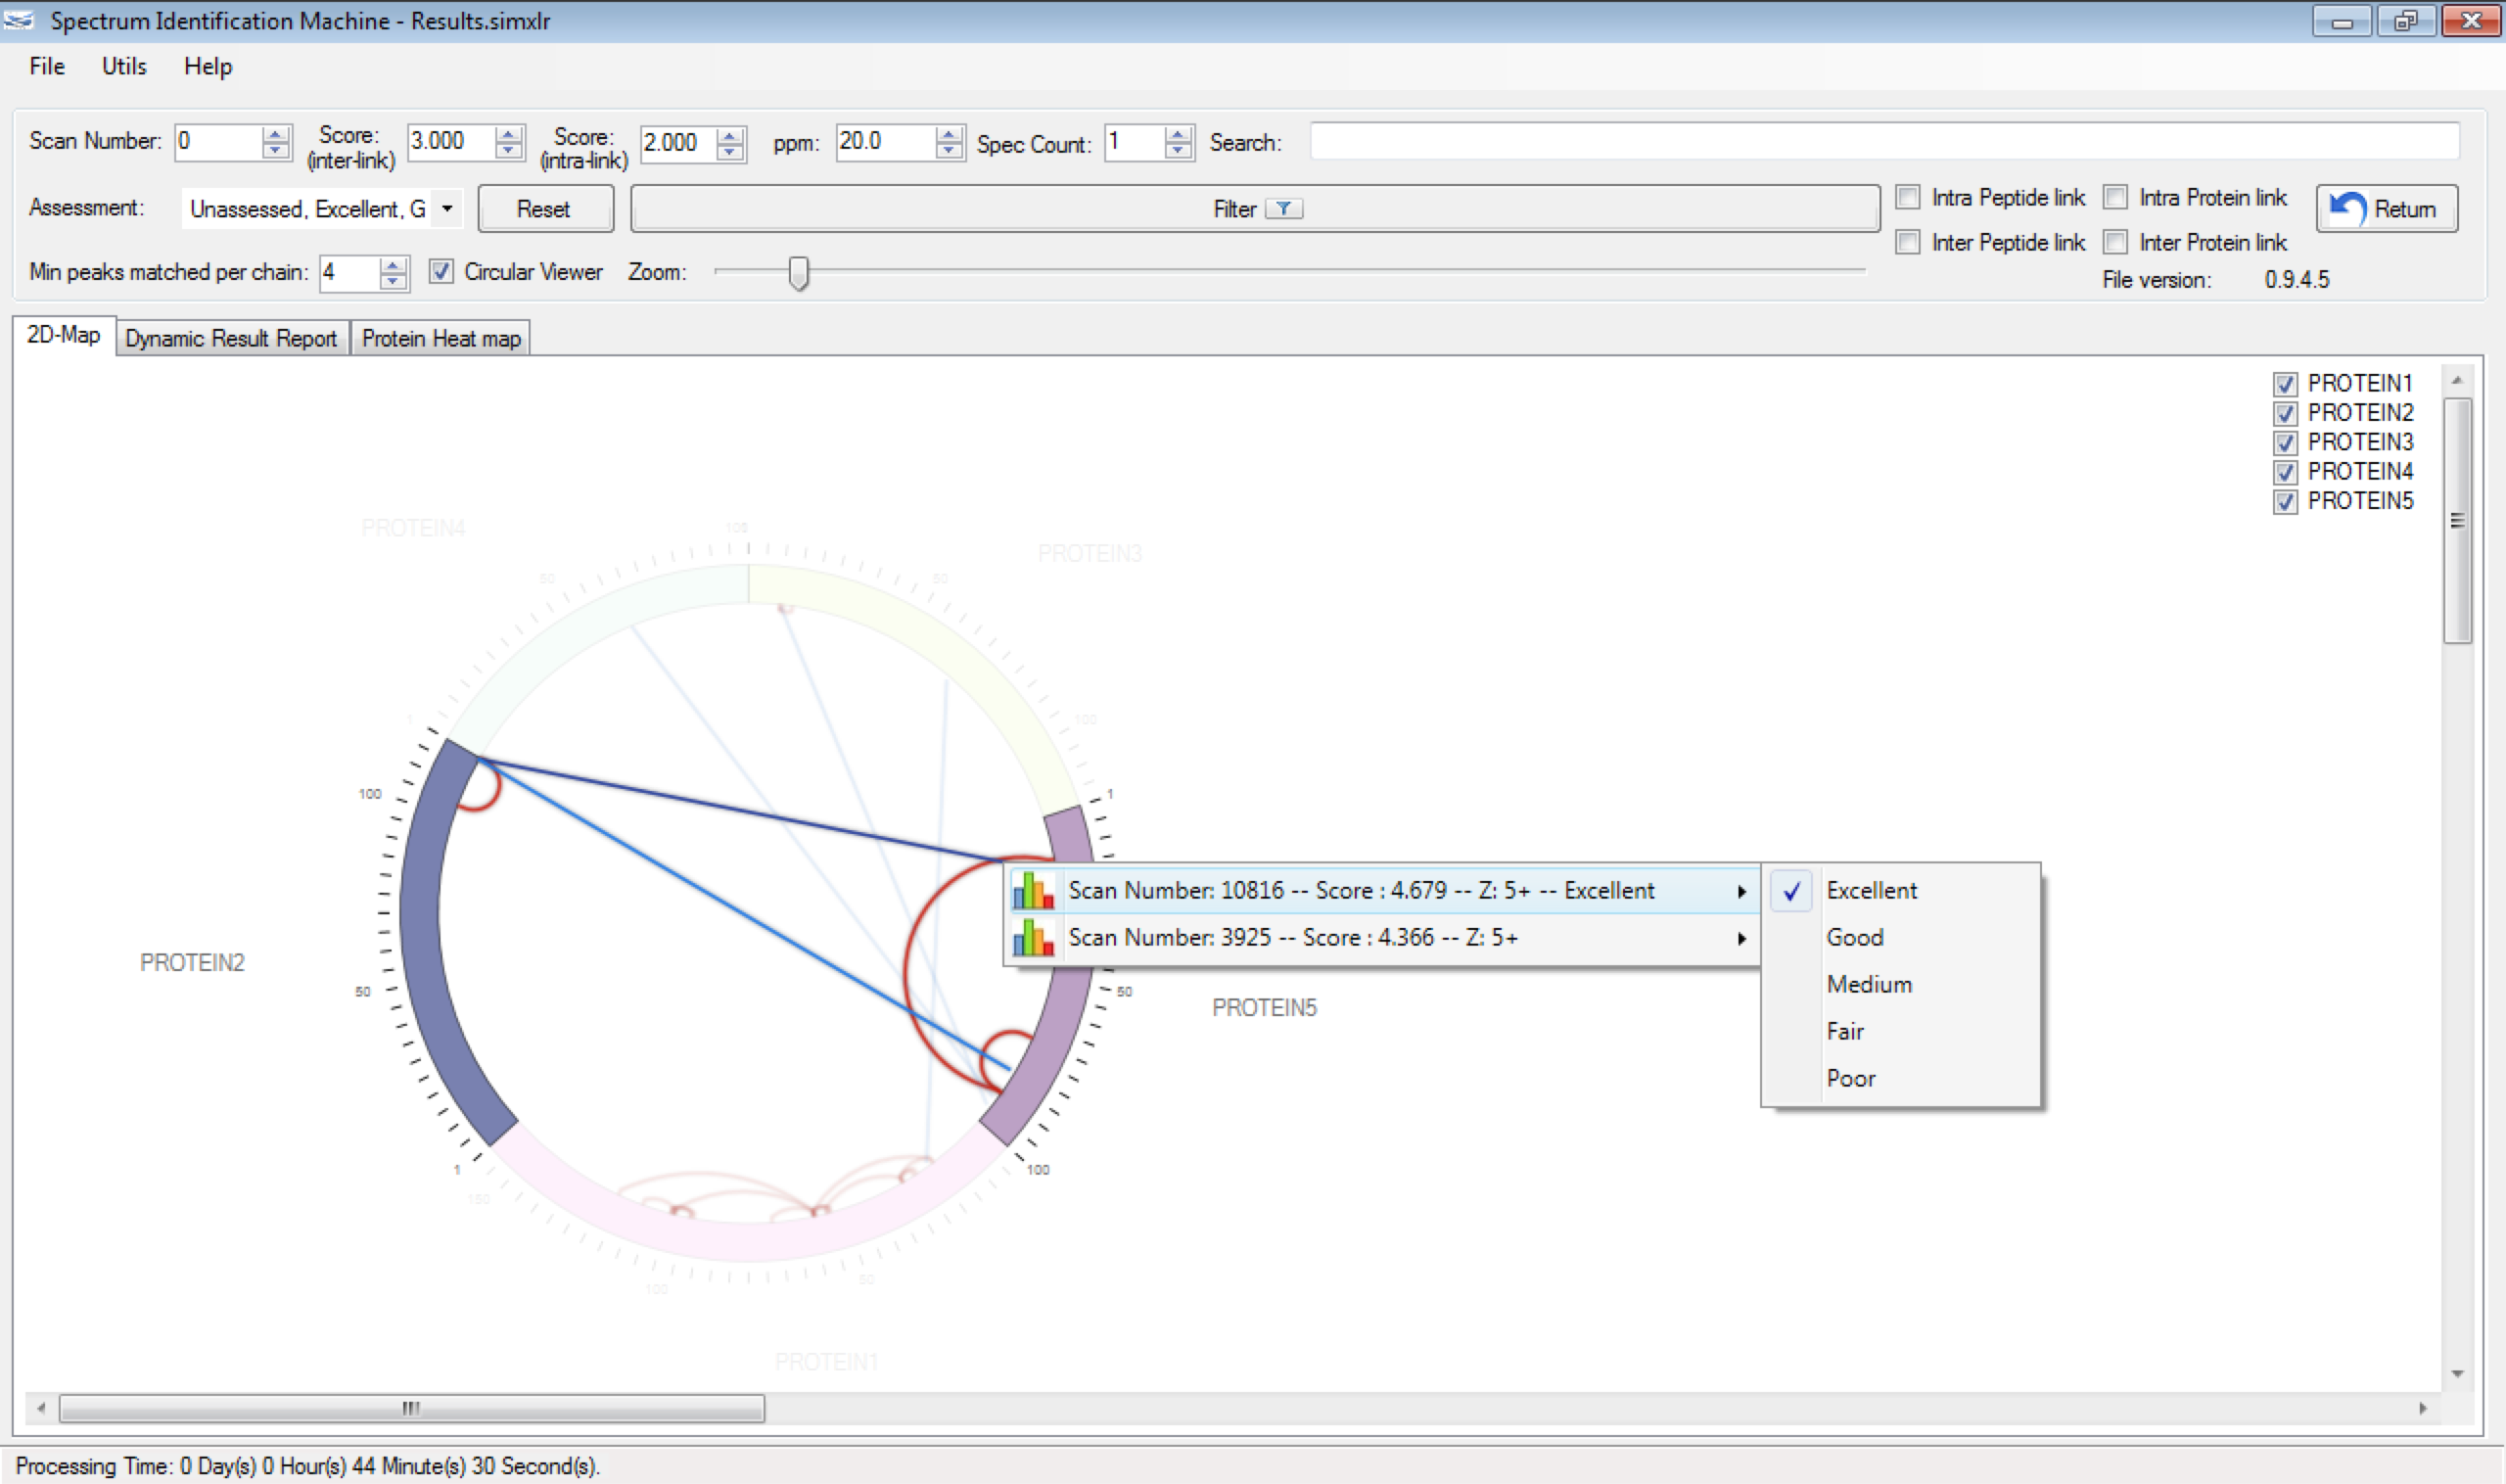
Figure 3 -
(NEW) PyMOL script: The user can export all spatial constraints obtained from the dynamic report result, by clicking on File menu → Export results → PyMOL Script (or pressing ALT + P). All identified cross-links can be exported or only certain proteins. Some data can be filtered on dynamic result report before be exported. A new window will be opened (Figure 4). Some parameters can be customized, and it is necessary to input the Protein Data Bank (PDB) file for obtaining previous information about the protein model.
Figure 4 - We suggest to reset all setting values by clicking on 'Initial Setting' button in the 'About' window (Help menu → About SIM).
Version 1.0.X
Version 1.0.3.0
Sep 15th, 2015
- Spectrum Viewer: The Peptide Annotation contains color according to series b e y; below the field Assessment appears the Precursor mass and Precursor charge, as can be seen in Figure 1.
- Spectrum Viewer: Optimized plotting spectrum.
- Results Browser:
- Hit Summary: The user can export a protein heat map summary containing all information about the interactions, by clicking on File menu → Protein heat map → Export Data → Hit Summary (or pressing ALT + U)
- Load and save SIM-XL results have been optimized. The user has to save old *.simxlr files to new version.
- Renamed Peaks Matched cutoff field to Min peaks matched per chain. The meaning is the same.
- Optimized search for large databases.
- Comet® updated to 2015.02 version.
- File Converter: The user can convert Thermo® RAW file in MS1 and/or MS2 and/or MS3, as well as MGF file.
- Enzyme: Added other enzymes in dropdown list.
- All setting values can be reset by clicking on Initial Setting button in the About window (Help menu → About SIM).
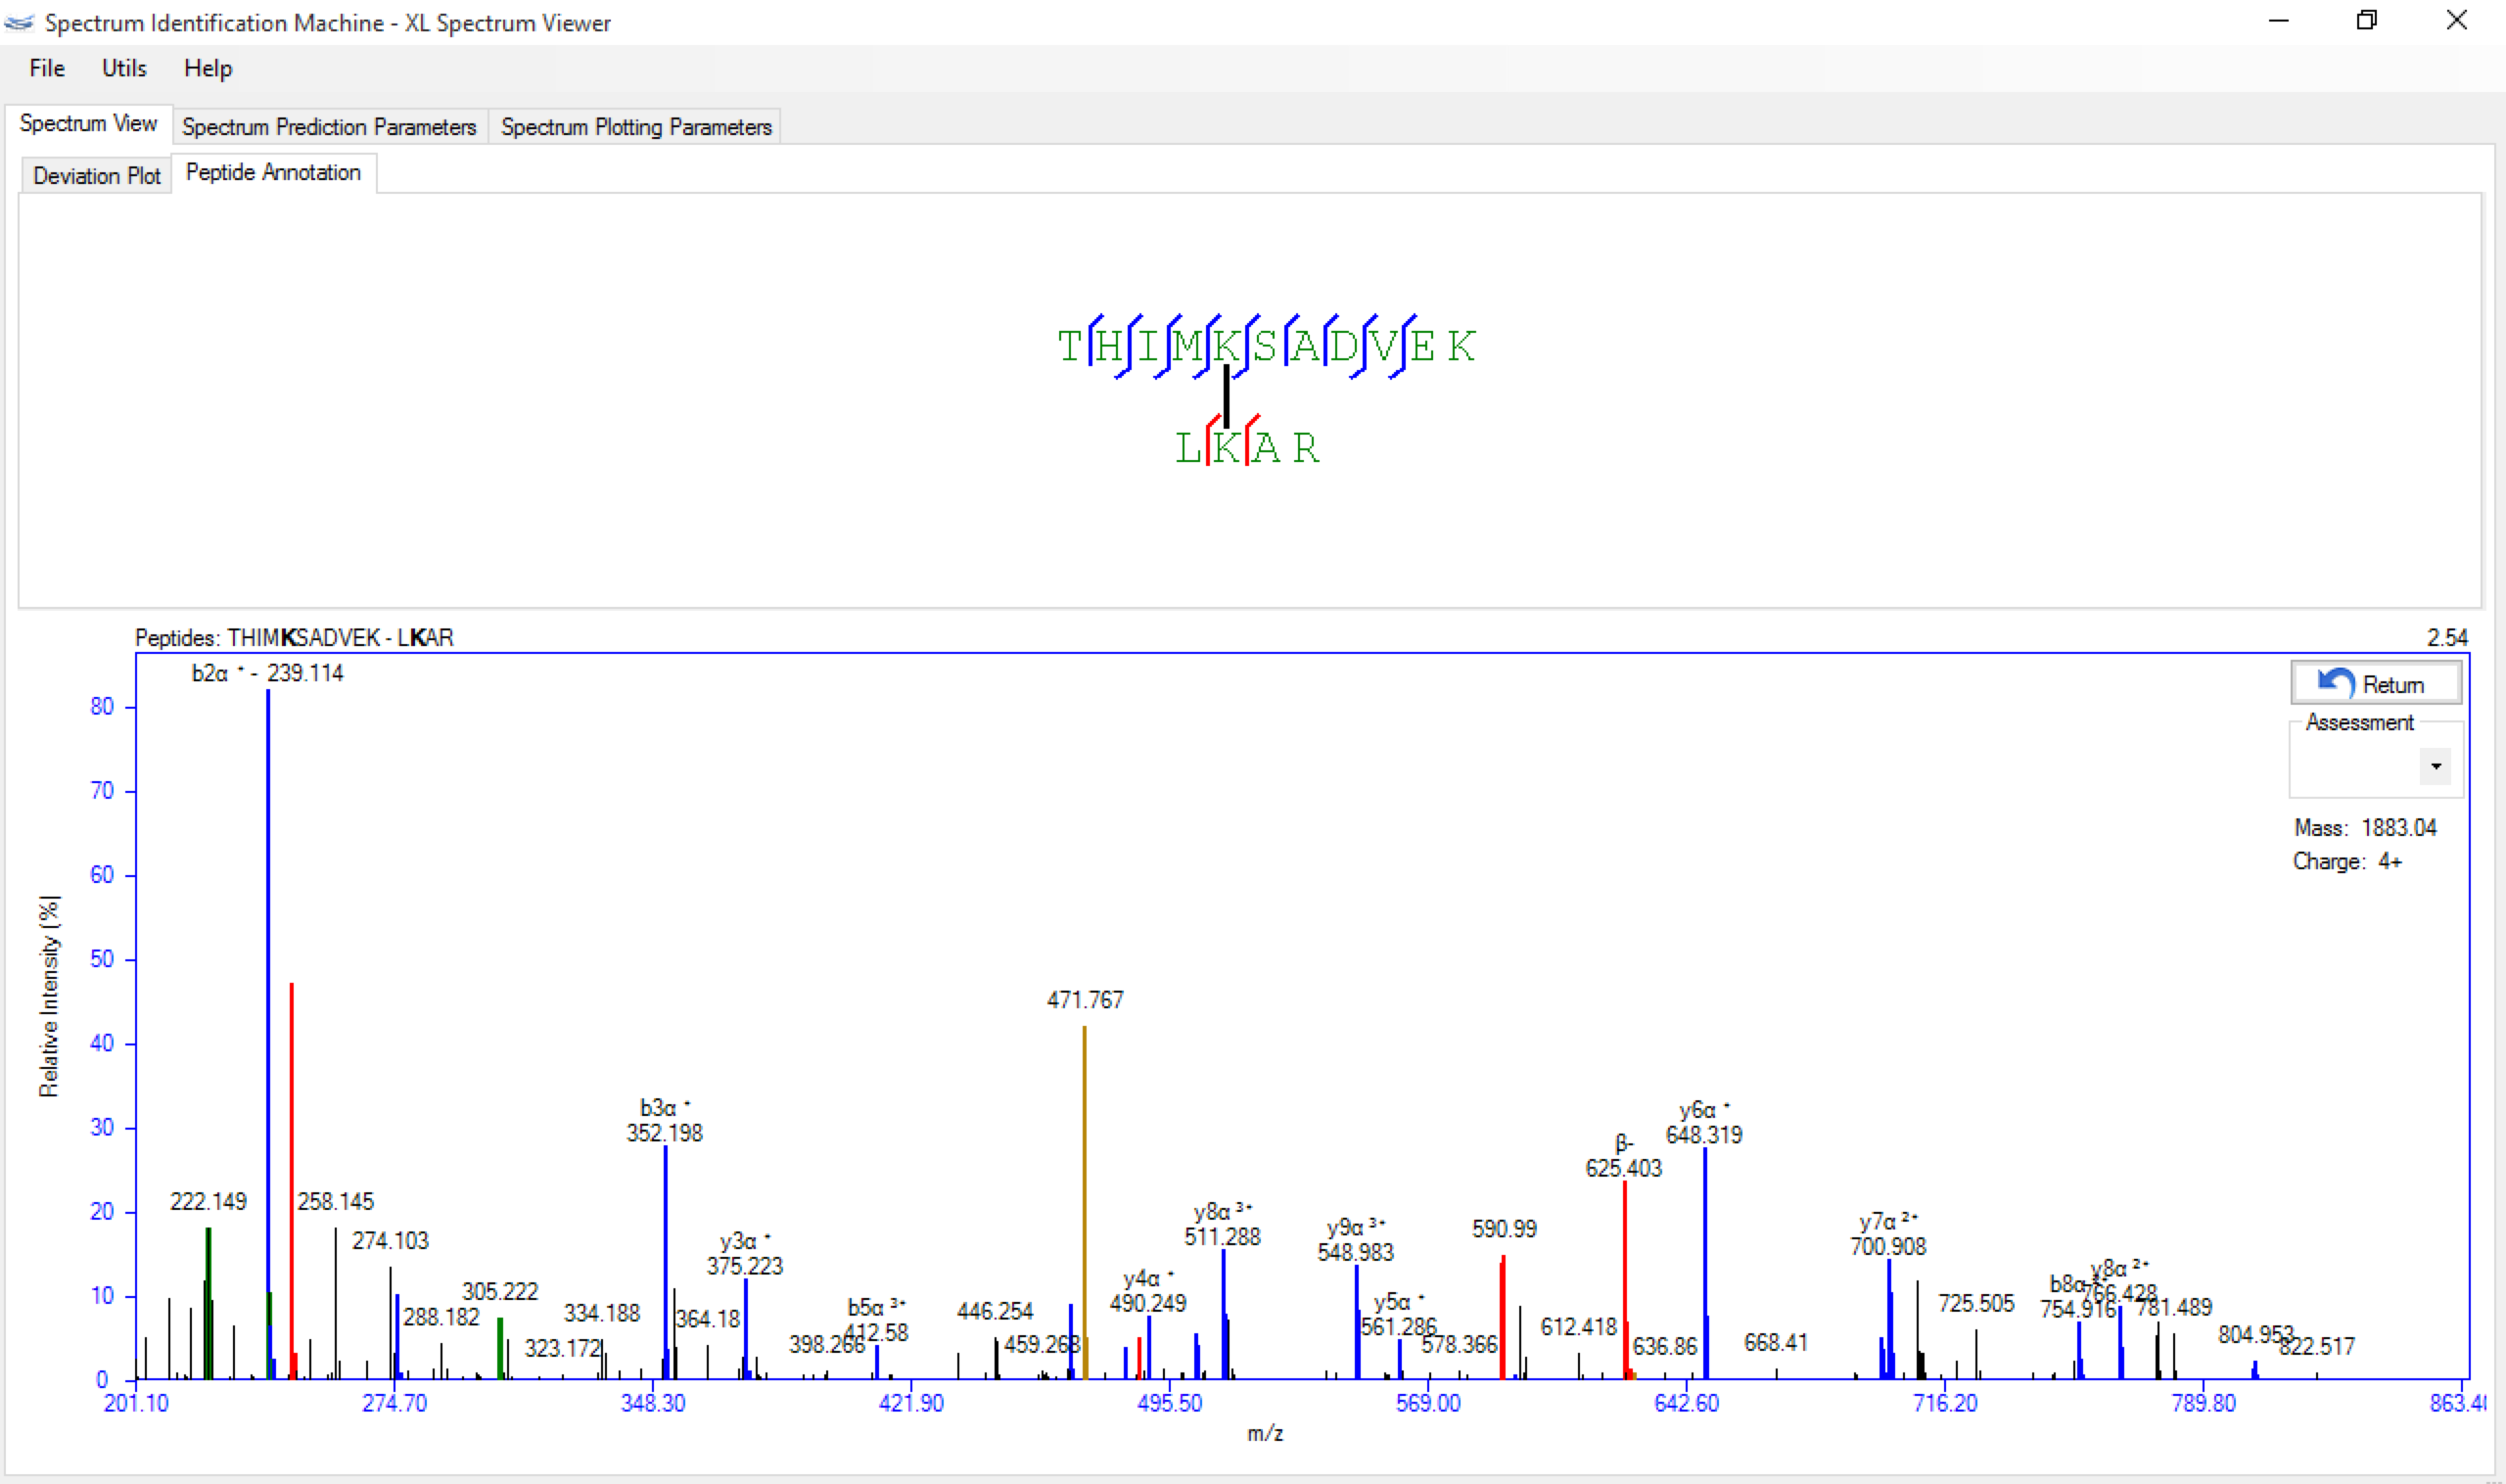
Figure 1
Version 1.0.2.1
June 16th, 2015
- Residue Library: The user can add, edit or remove a molecular formula of a specific residue, by clicking on the Utils menu (or pressing CTRL + R) from main SIM-XL GUI.
- Enzyme: The user can specify more than one enzyme to cleavage the protein sequence in silico. It is also allowed to determine if enzyme cleavages in C or N-term.
- Spectrum Viewer: The user can assess the spectrum selecting an option in the dropdown list, as you can see in Figure 1.
- Results Browser:
- Assessment: The user can specify more than one filter to show, as well as unassessed links.
- Peaks matched cut-off: Only results that contain the minimum peaks matched will be displayed.
- The user can specify which proteins will be displayed on 2D-Map, as you can see in Figure 2a.
- The user can assess the link by right-clicking on inter/intra-link, and selecting the better option that satisfies the quality of spectrum (Figure 2b). The evaluated links will have their color changed slightly.
- To access the Spectrum Viewer through the 2D-Map, the user can right-click on inter/intra-link, and after that, double-click on the specific result.
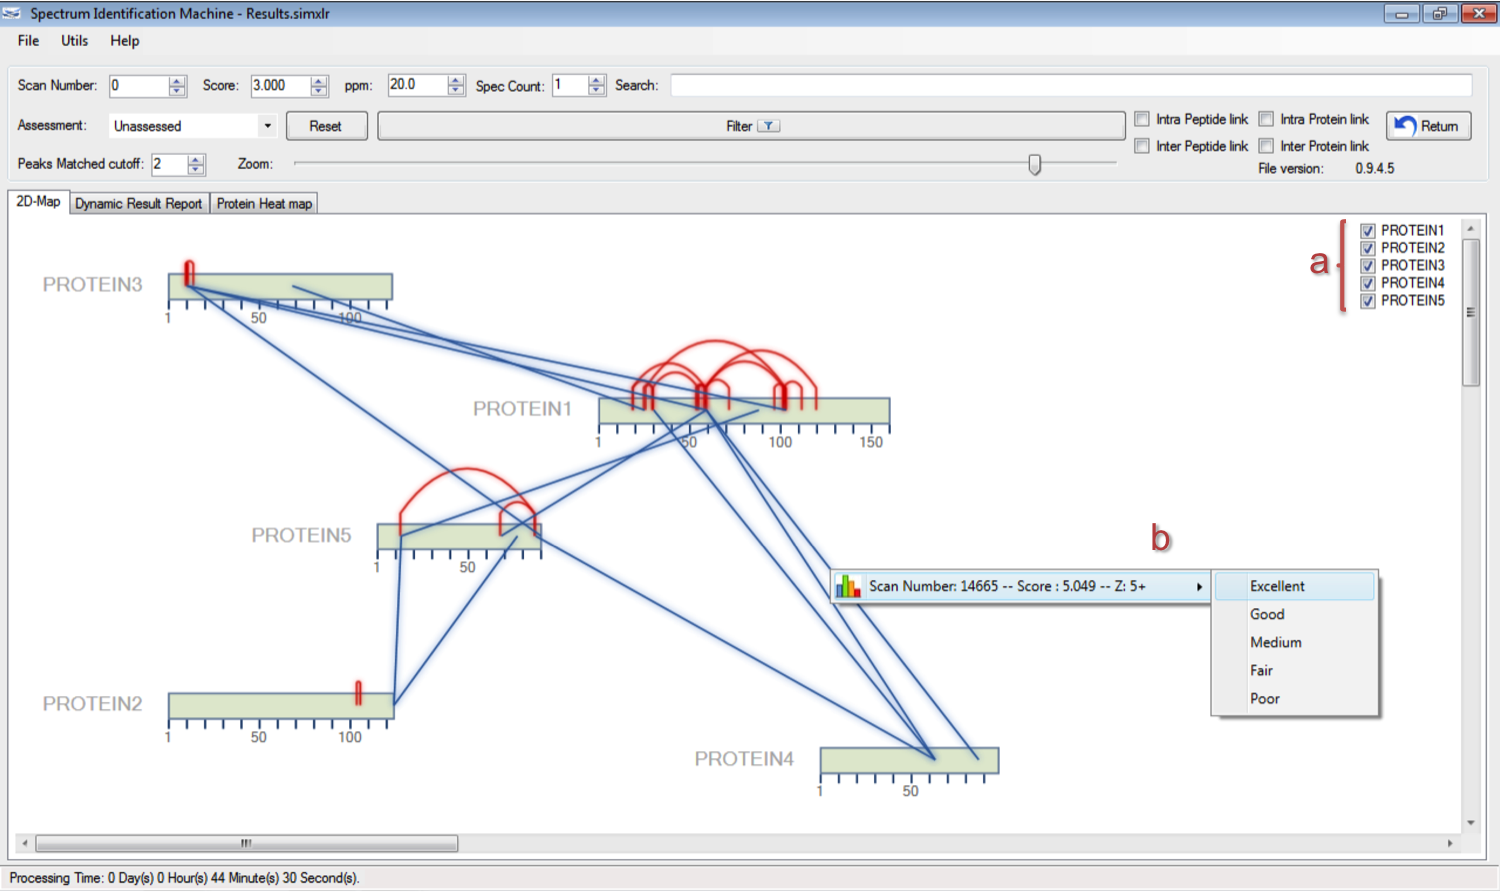
Figure 2 - Optimized search.
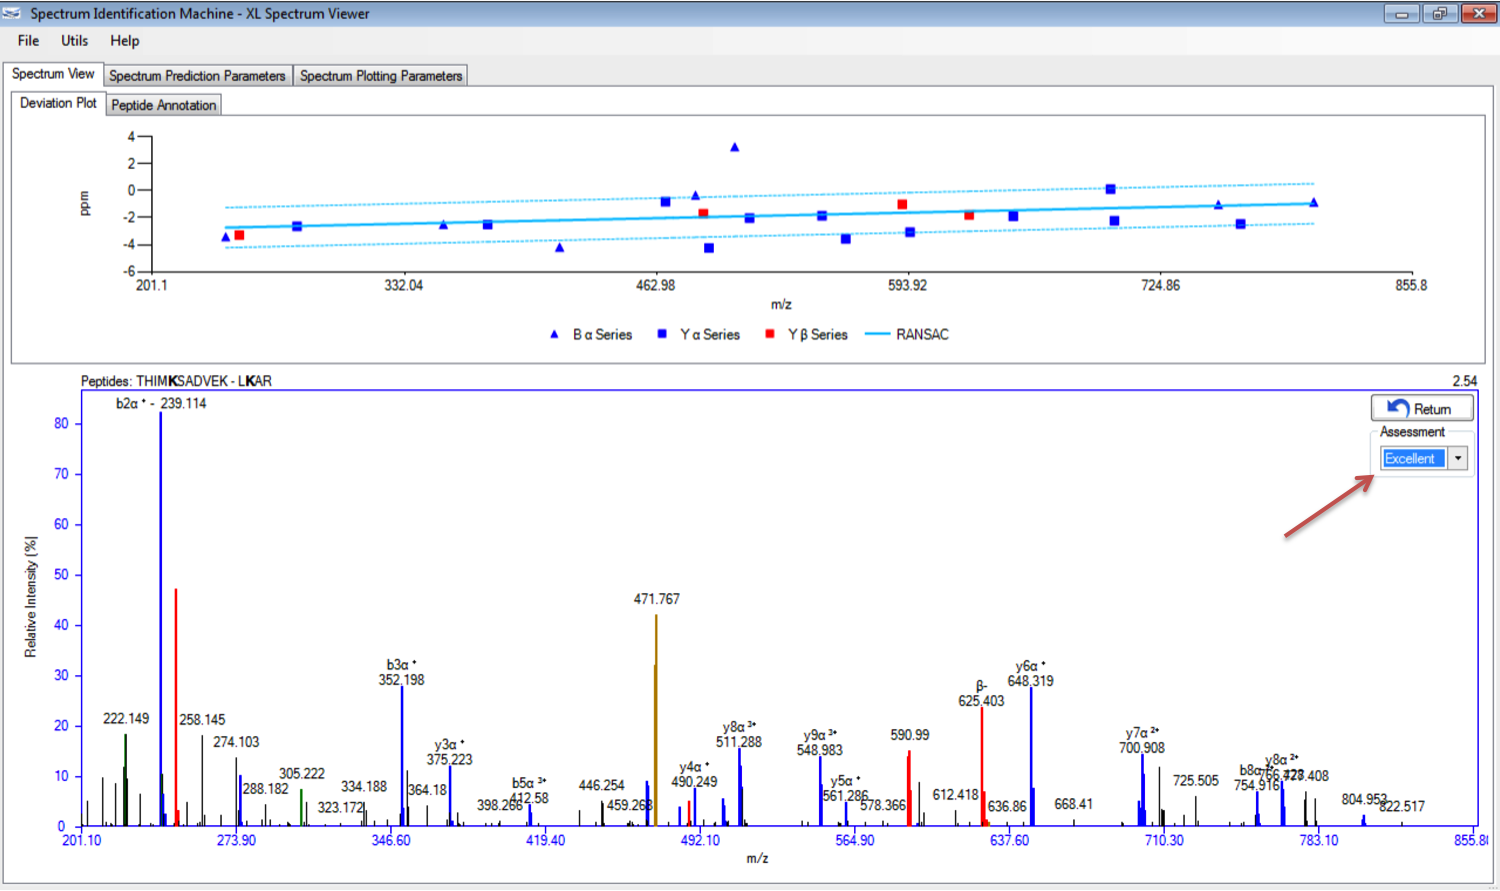
Figure 1
Version 1.0.1.0
May 19th, 2015
- Customization of the residue library: The user can add, edit or remove a specific residue accessing the Residue library, by clicking on the Utils menu (or pressing CTRL + R) from main SIM-XL GUI.
- Results Browser:
- Search: Only results from peptides or file name (source file) containing the sequence input to this field will be displayed.
- The user can add the m/z column in the Dynamic Result Report.
- Spec Count: Only results that contain the minimum number of observations, specified in this field, for each peptide sequence will be displayed.
- Export Hit Detail data from Protein Heat map: This option allows to export all information about the selected proteins.
- Bug fixed when the user checked Inter peptide link for finding out the results.
- Optimized search when N-TERM is specified as reaction site.
Version 1.0.0.10
May 8th, 2015
- Bug fixed when user set up only N-TERM as reaction site in XL Library.
- 2D-Map fixed to show links which contain N-TERM or C-TERM.
Version 1.0.0.9
March 13th, 2015
- Optimized filter in Dynamic Report Result.
- Improved main Graphical User Interface (GUI) layout.
Version 1.0.0.8
March 5th, 2015
- Optimized SIM-XL load results.
- Added scroll bar in 2D-Map visualization.
- Optimized Protein Heat map visualization.
- Fixed display SIM-XL mode.
Version 1.0.0.7
February 24th, 2015
- Perform searches with bigger protein sequence databases.
- Parameters file (e.g sim-xl_params.xml) can be stored when SIM-XL results file is saved. This file will not be saved automatically.
- Protein heat map: improved display matches.
Version 1.0.0.5
February 23th, 2015
- Protein Heat map bug fixed.
- Search cross-linked peptides improved.
Version 1.0.0.4
February 19th, 2015
- Added Retention Time and Type Protein Link columns in Dynamic Result Report. To visualize these columns the user can enable them on Utils menu → Custom Results Report in Results Browser.
Version 1.0.0.1
February 17th, 2015
- Added two columns in Dynamic Result Report displaying the position of cross-link residues in protein sequence.
- Fixed XL-residue position in SIM-XL output file (*.simxlr).
- Results Browser: If the user tries to close the window and is not saved the results, a message will be displayed reminding to save them.
- Help: Added Open local protocol button if the user wants to visualize the local version of Nature Protocol Exchange.
Version 1.0.0.0
February 12th, 2015
- The Gold Master (GM) version.