How SIM-XL works

This Nature Protocol Exchange explains how SIM-XL works and how the parameters must be used. There are many details which need to be read with attention.
Homodimer analyses
This Nature Protocols explains how to perform a homodimer analyses.
 Melchior, J.T., Walker, R.G., Morris, J., Jones, M.K., Segrest J.P., Lima, D.B., Carvalho, P.C., Gozzo, F.C., Castleberry, M., Thompson, T.B., W. Sean Davidson, “An Evaluation of the Crystal Structure of C-terminal Truncated Apolipoprotein A-I in Solution Reveals Structural Dynamics Related to Lipid Binding”, The Journal of Biological Chemistry (291): pp 5439-5451, 2016.
Get started
After installing SIM-XL, the user is able for performing a search. Follow step-by-step below to load default parameters and perform the first search.
- In Supplementary files download the SIM-XL parameters and the results obtained to manuscript.
- Download the RAW or MS2 files at PRIDE Repository.
- Download the protein sequence database used in the manuscript.
- Load the SIM-XL, by clicking on File menu → Load SIM-XL params (or press ALT + L) and select the sim-xl_params.xml downloaded from step 1.
- Specify in Sequence database field, the protein sequence database downloaded from step 3.
- Specify the directory where are the RAW or MS2 files downloaded from PRIDE Repository.
- By clicking on GO button, the search will start.
- By double-clicking on result files downloaded from step 1, the user can access the 2D-Map, Dynamic Result Report and Protein Heat map of these files.
Note: The images below summarize how SIM-XL works.
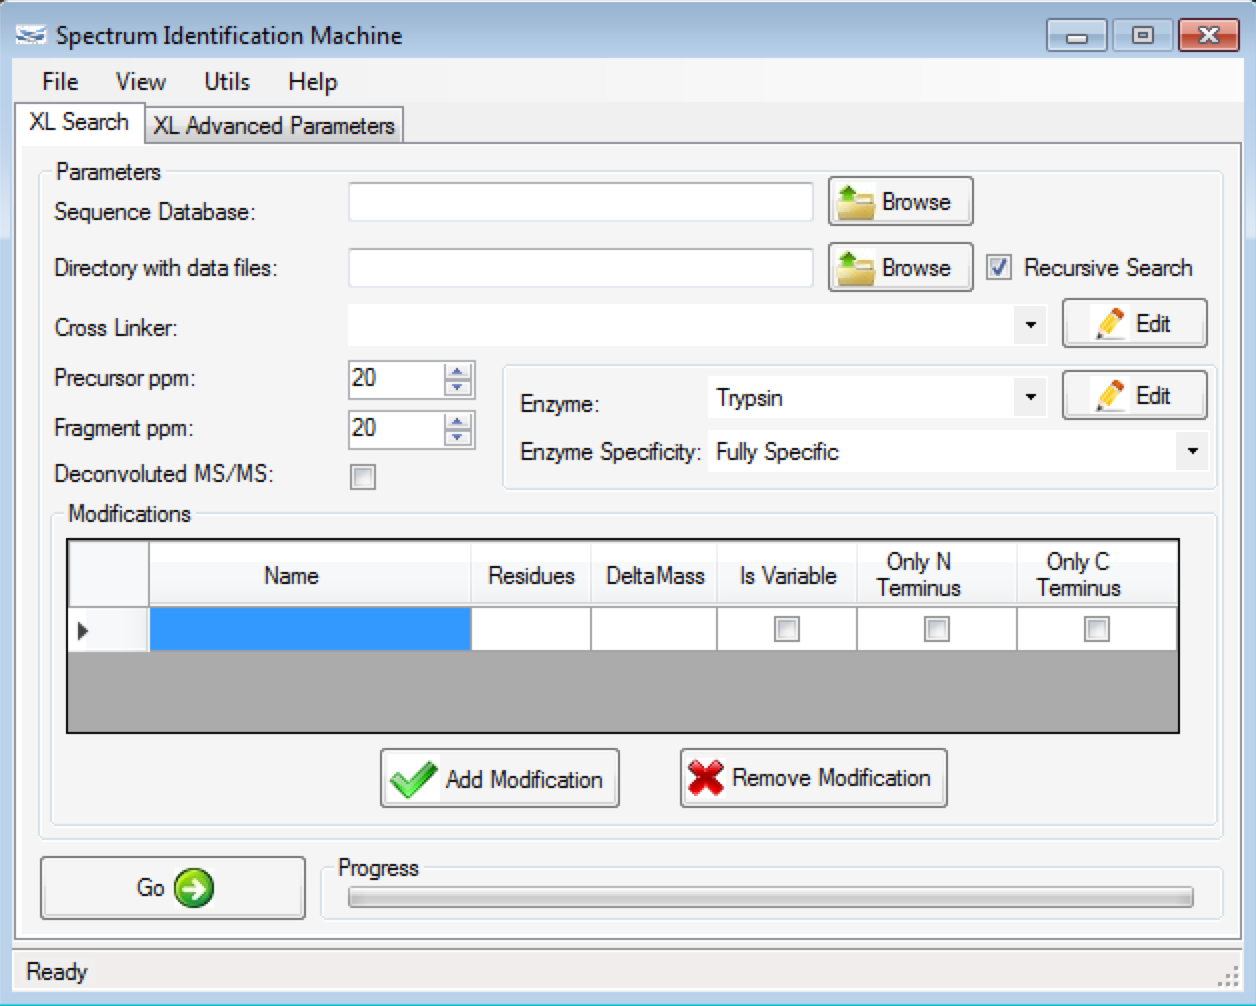 Figure 1
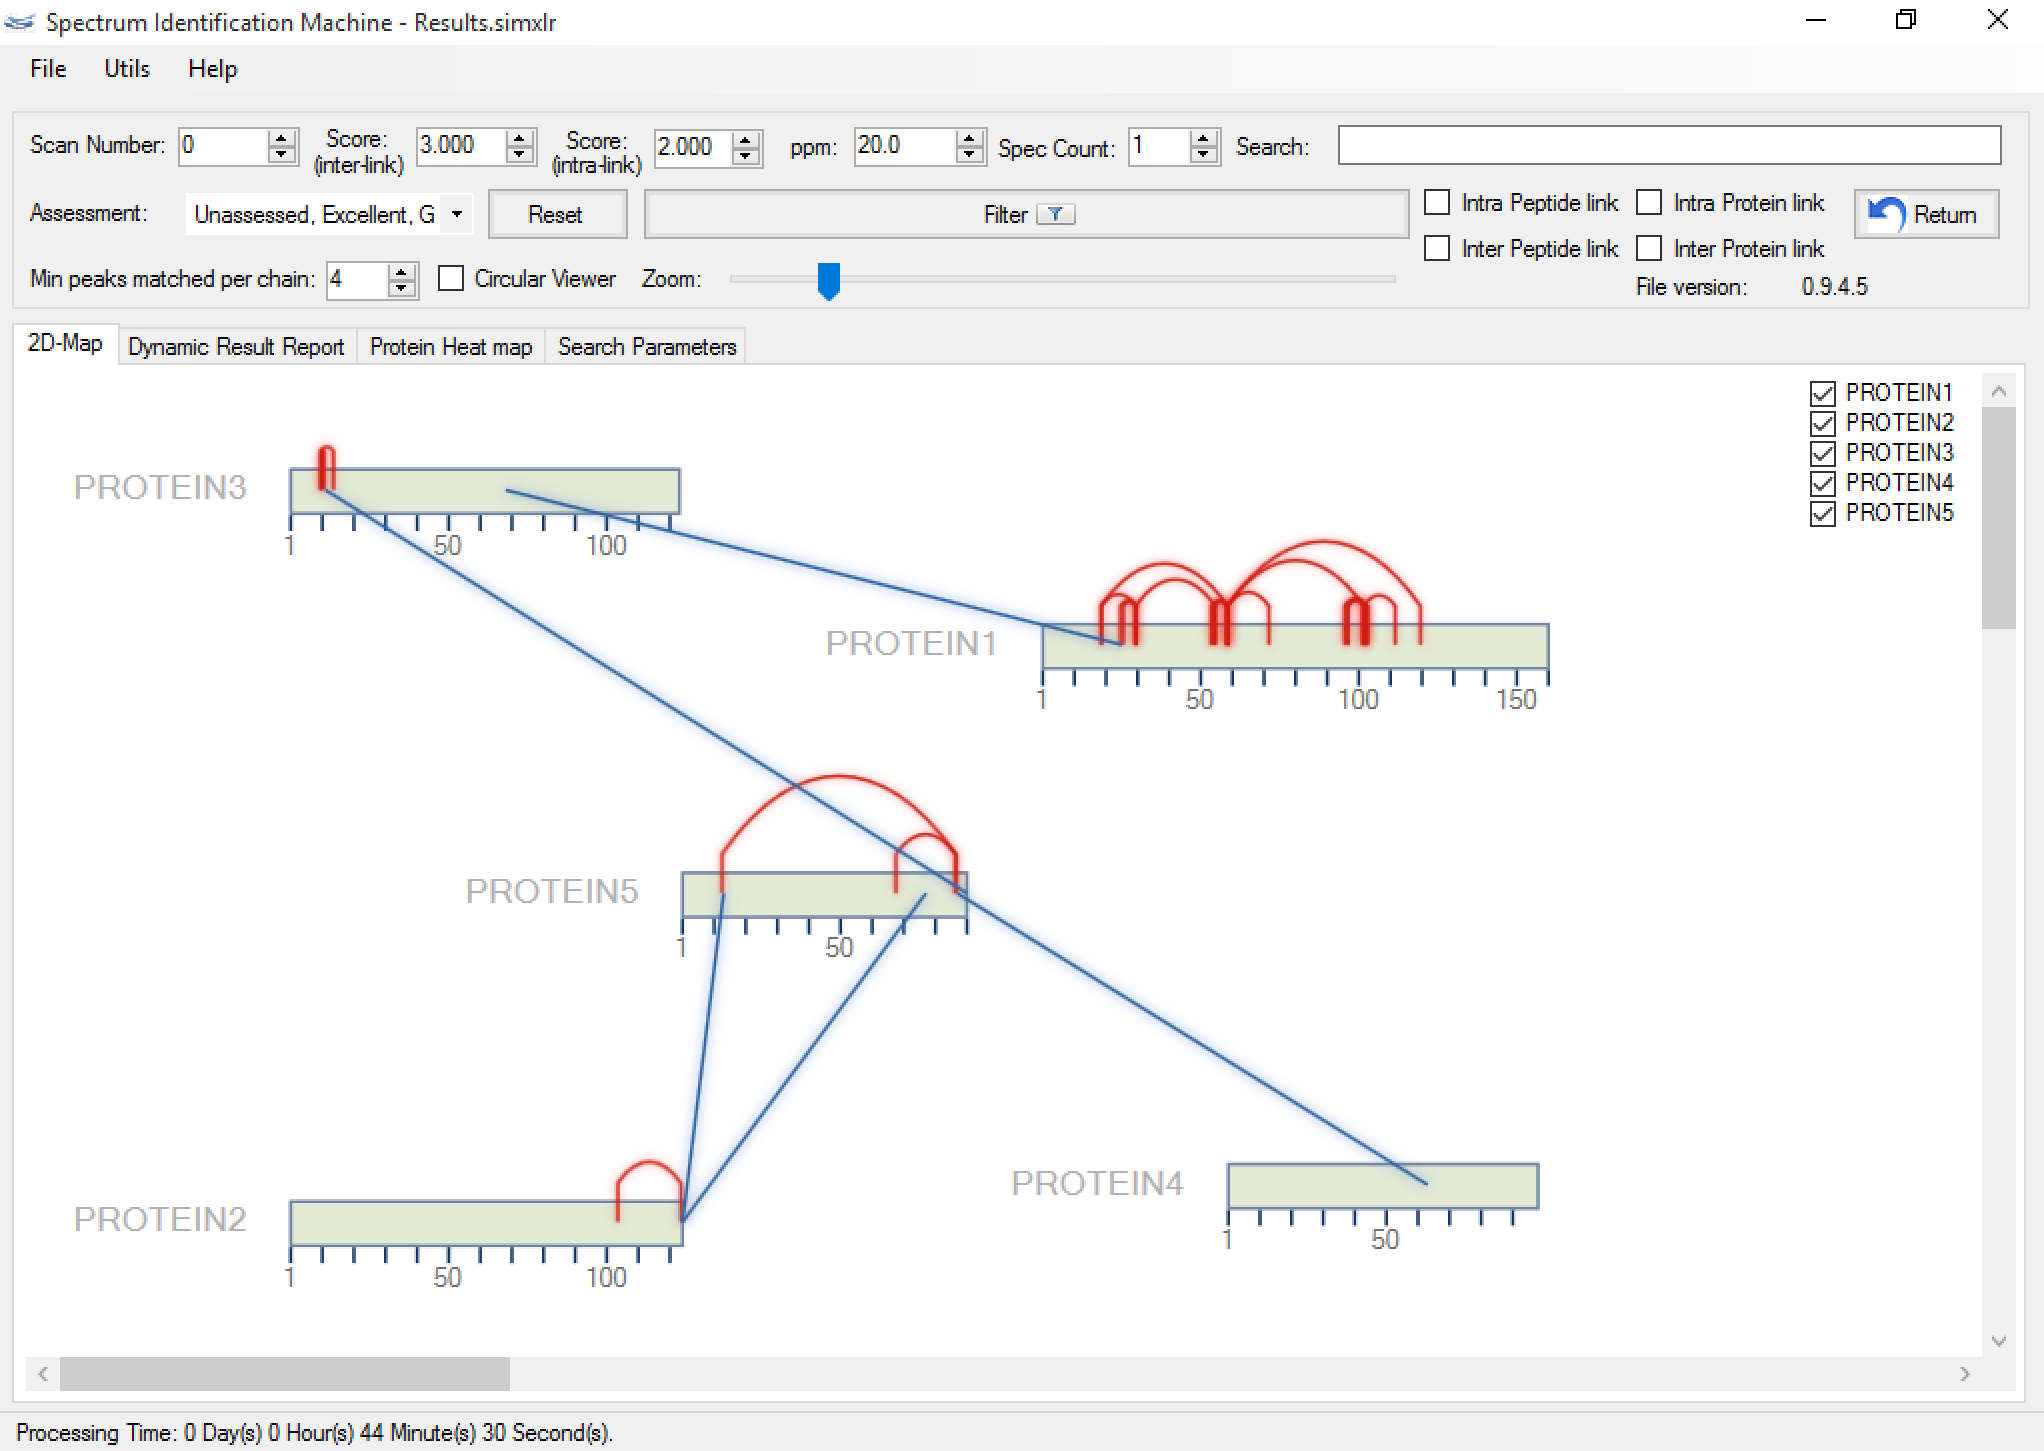
Figure 2a
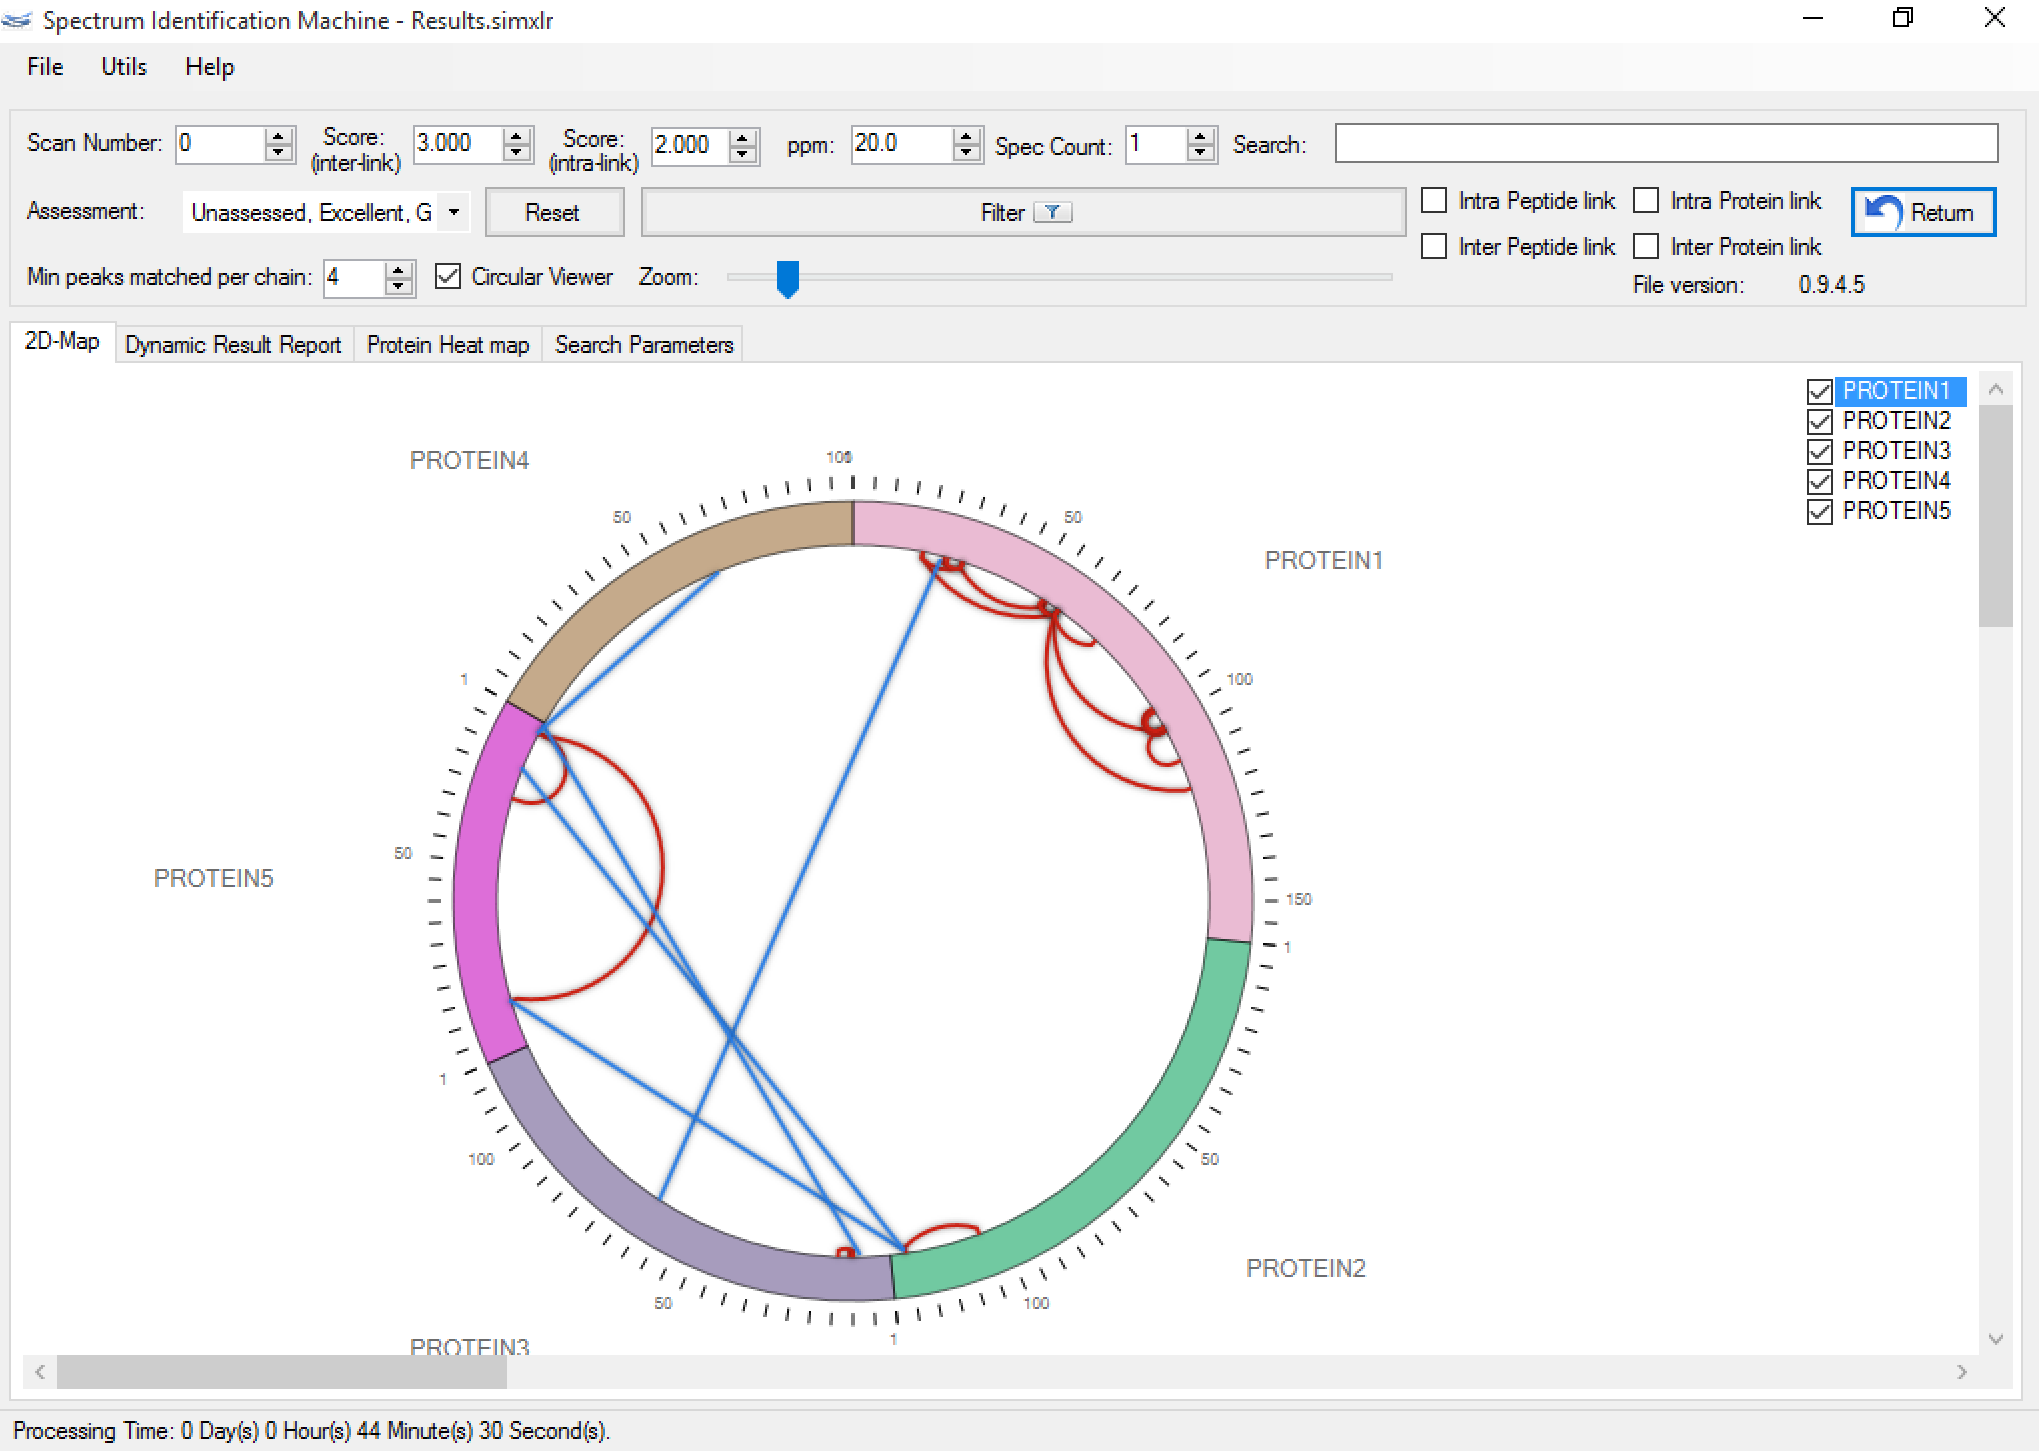
Figure 2b
Figure 1 shows the main SIM-XL GUI. It provides an unmatched toolbox for viewing, annotating, assessing, and validating mass spectra of cross-linked peptides that ultimately enables generating comprehensive diagrams of protein-protein interactions. SIM-XL can generate a bar (Figure 2a) and a circular 2D-Map (Figure 2b); both can be changed with just one click.
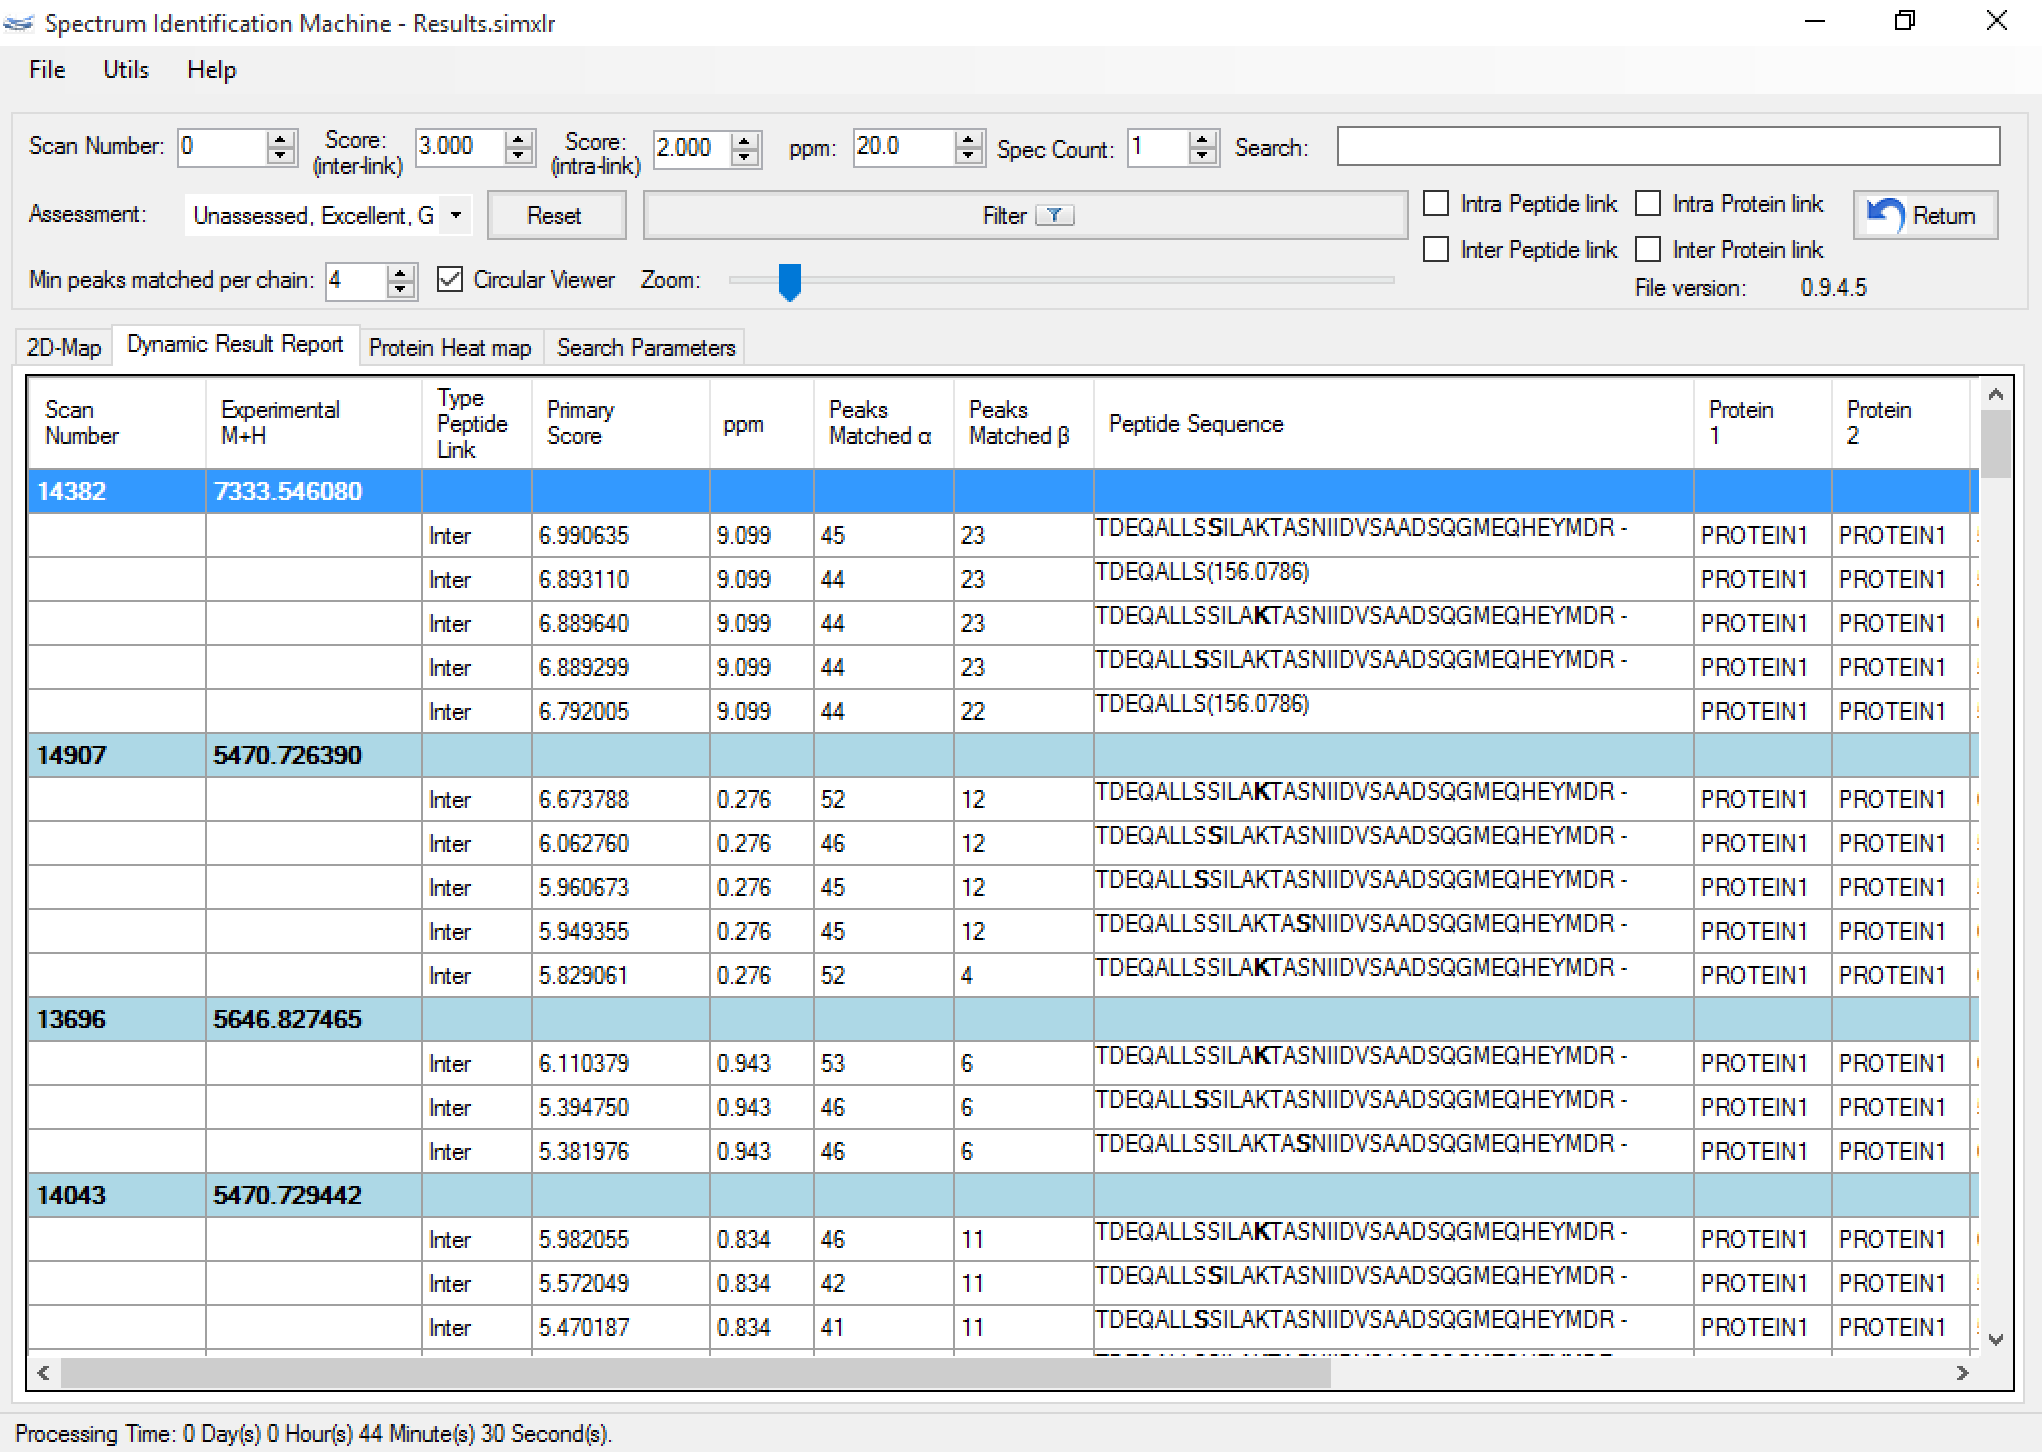 Figure 3
A dynamic report is also generated (Figure 3) as a result, and it allows the sorting/searching of results according to a user-specified criterion, as well as accessing the spectrum viewer by double-clicking on an identification. The user can also save individual assessments through the drop-down menu beside each identification. Five choices are available, from Excellent to Poor. Through this interface, the user can also contribute to a global effort for generating an online library of high-quality identified XL spectra. This should aid in the development of more effective scoring functions and in the study of fragmentation patterns addressing different instruments and cross-linkers.
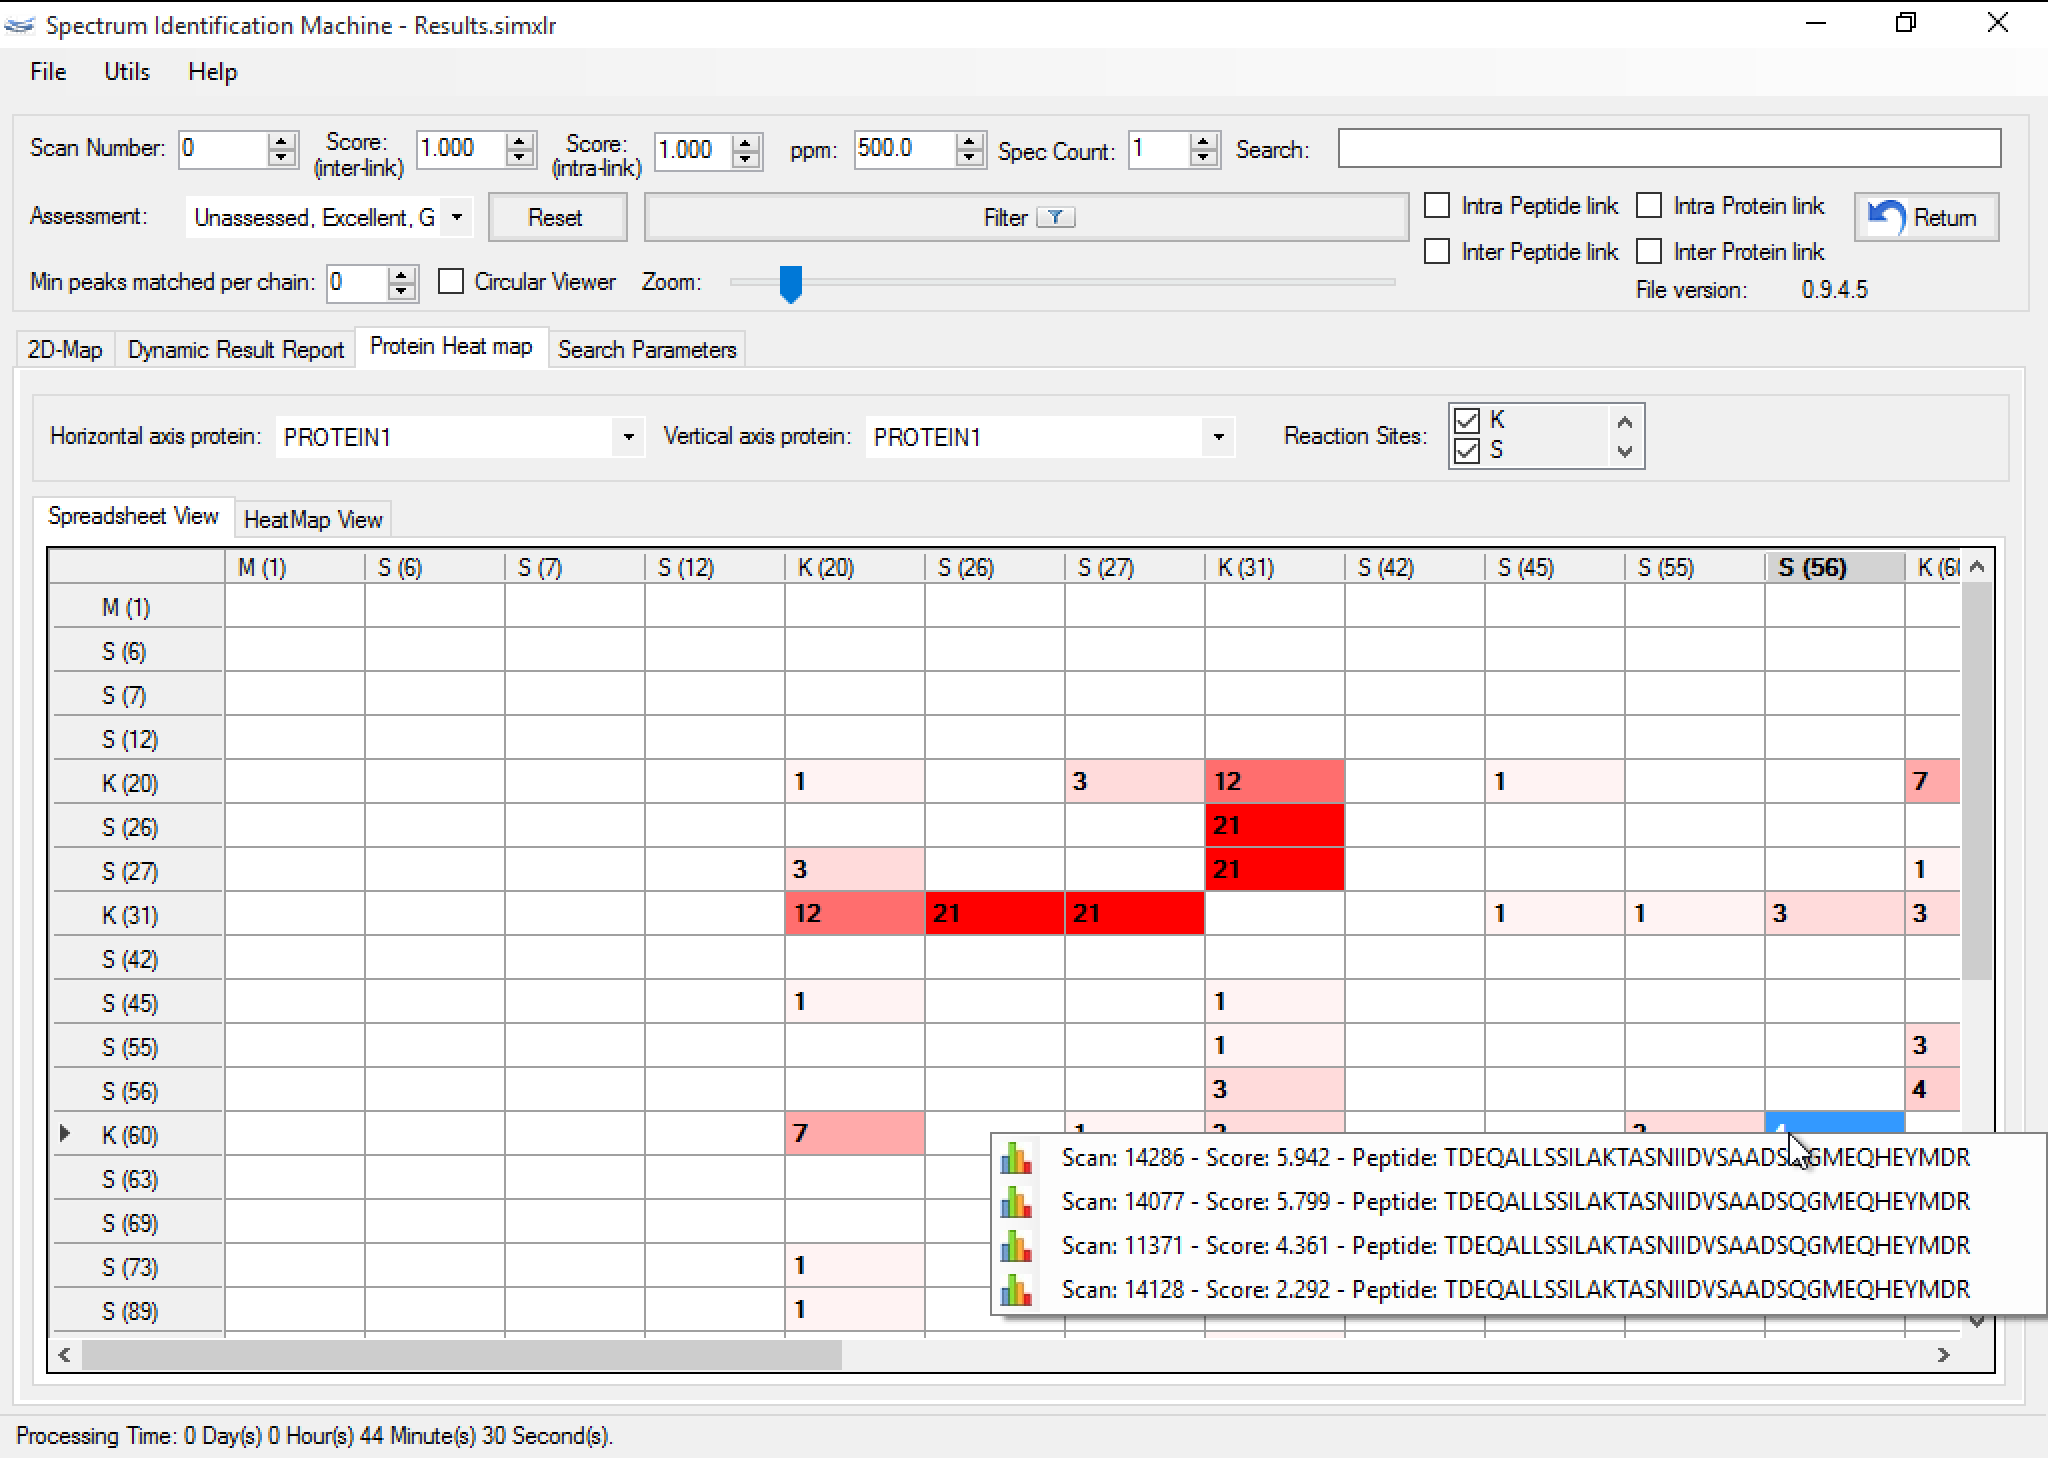 Figure 4
Figure 4 shows the protein heatmap which the user can visualize all interactions between the proteins identified. The user can choose two proteins identified to visualize their interactions and he can hide some reaction sites and see a heatmap more simple. This feature is coupled with other tabs, so when the user applies some filter, all tabs may reflect the result.
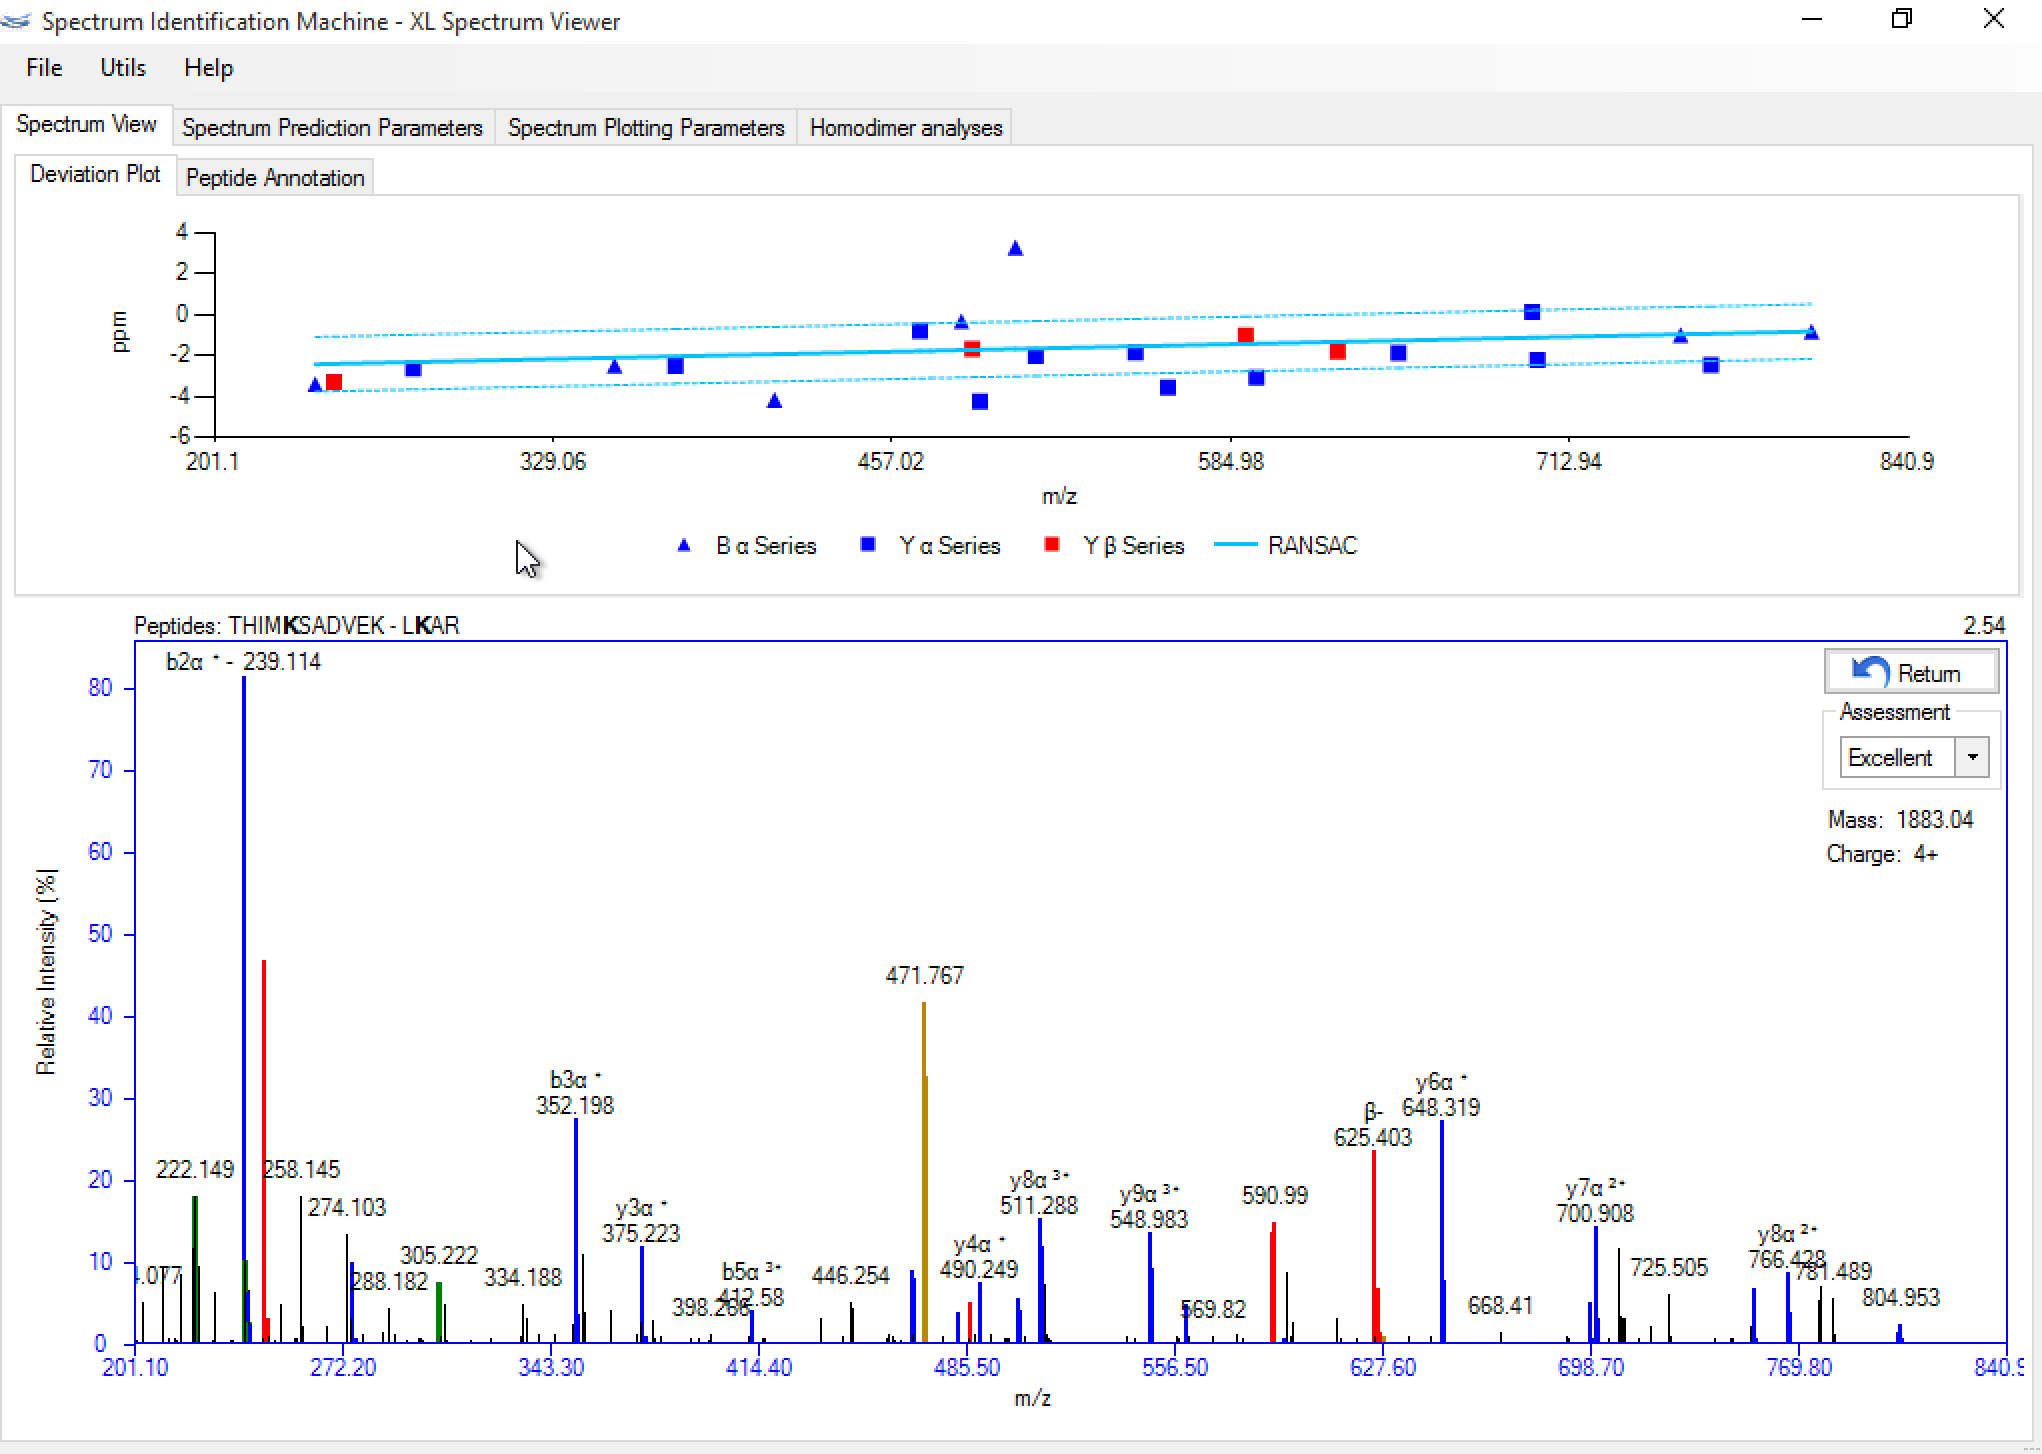 Figure 5
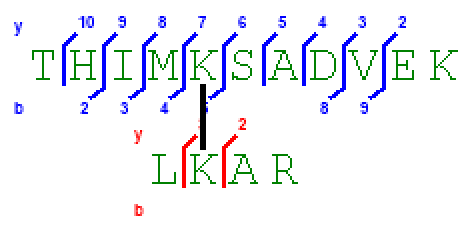 Figure 6
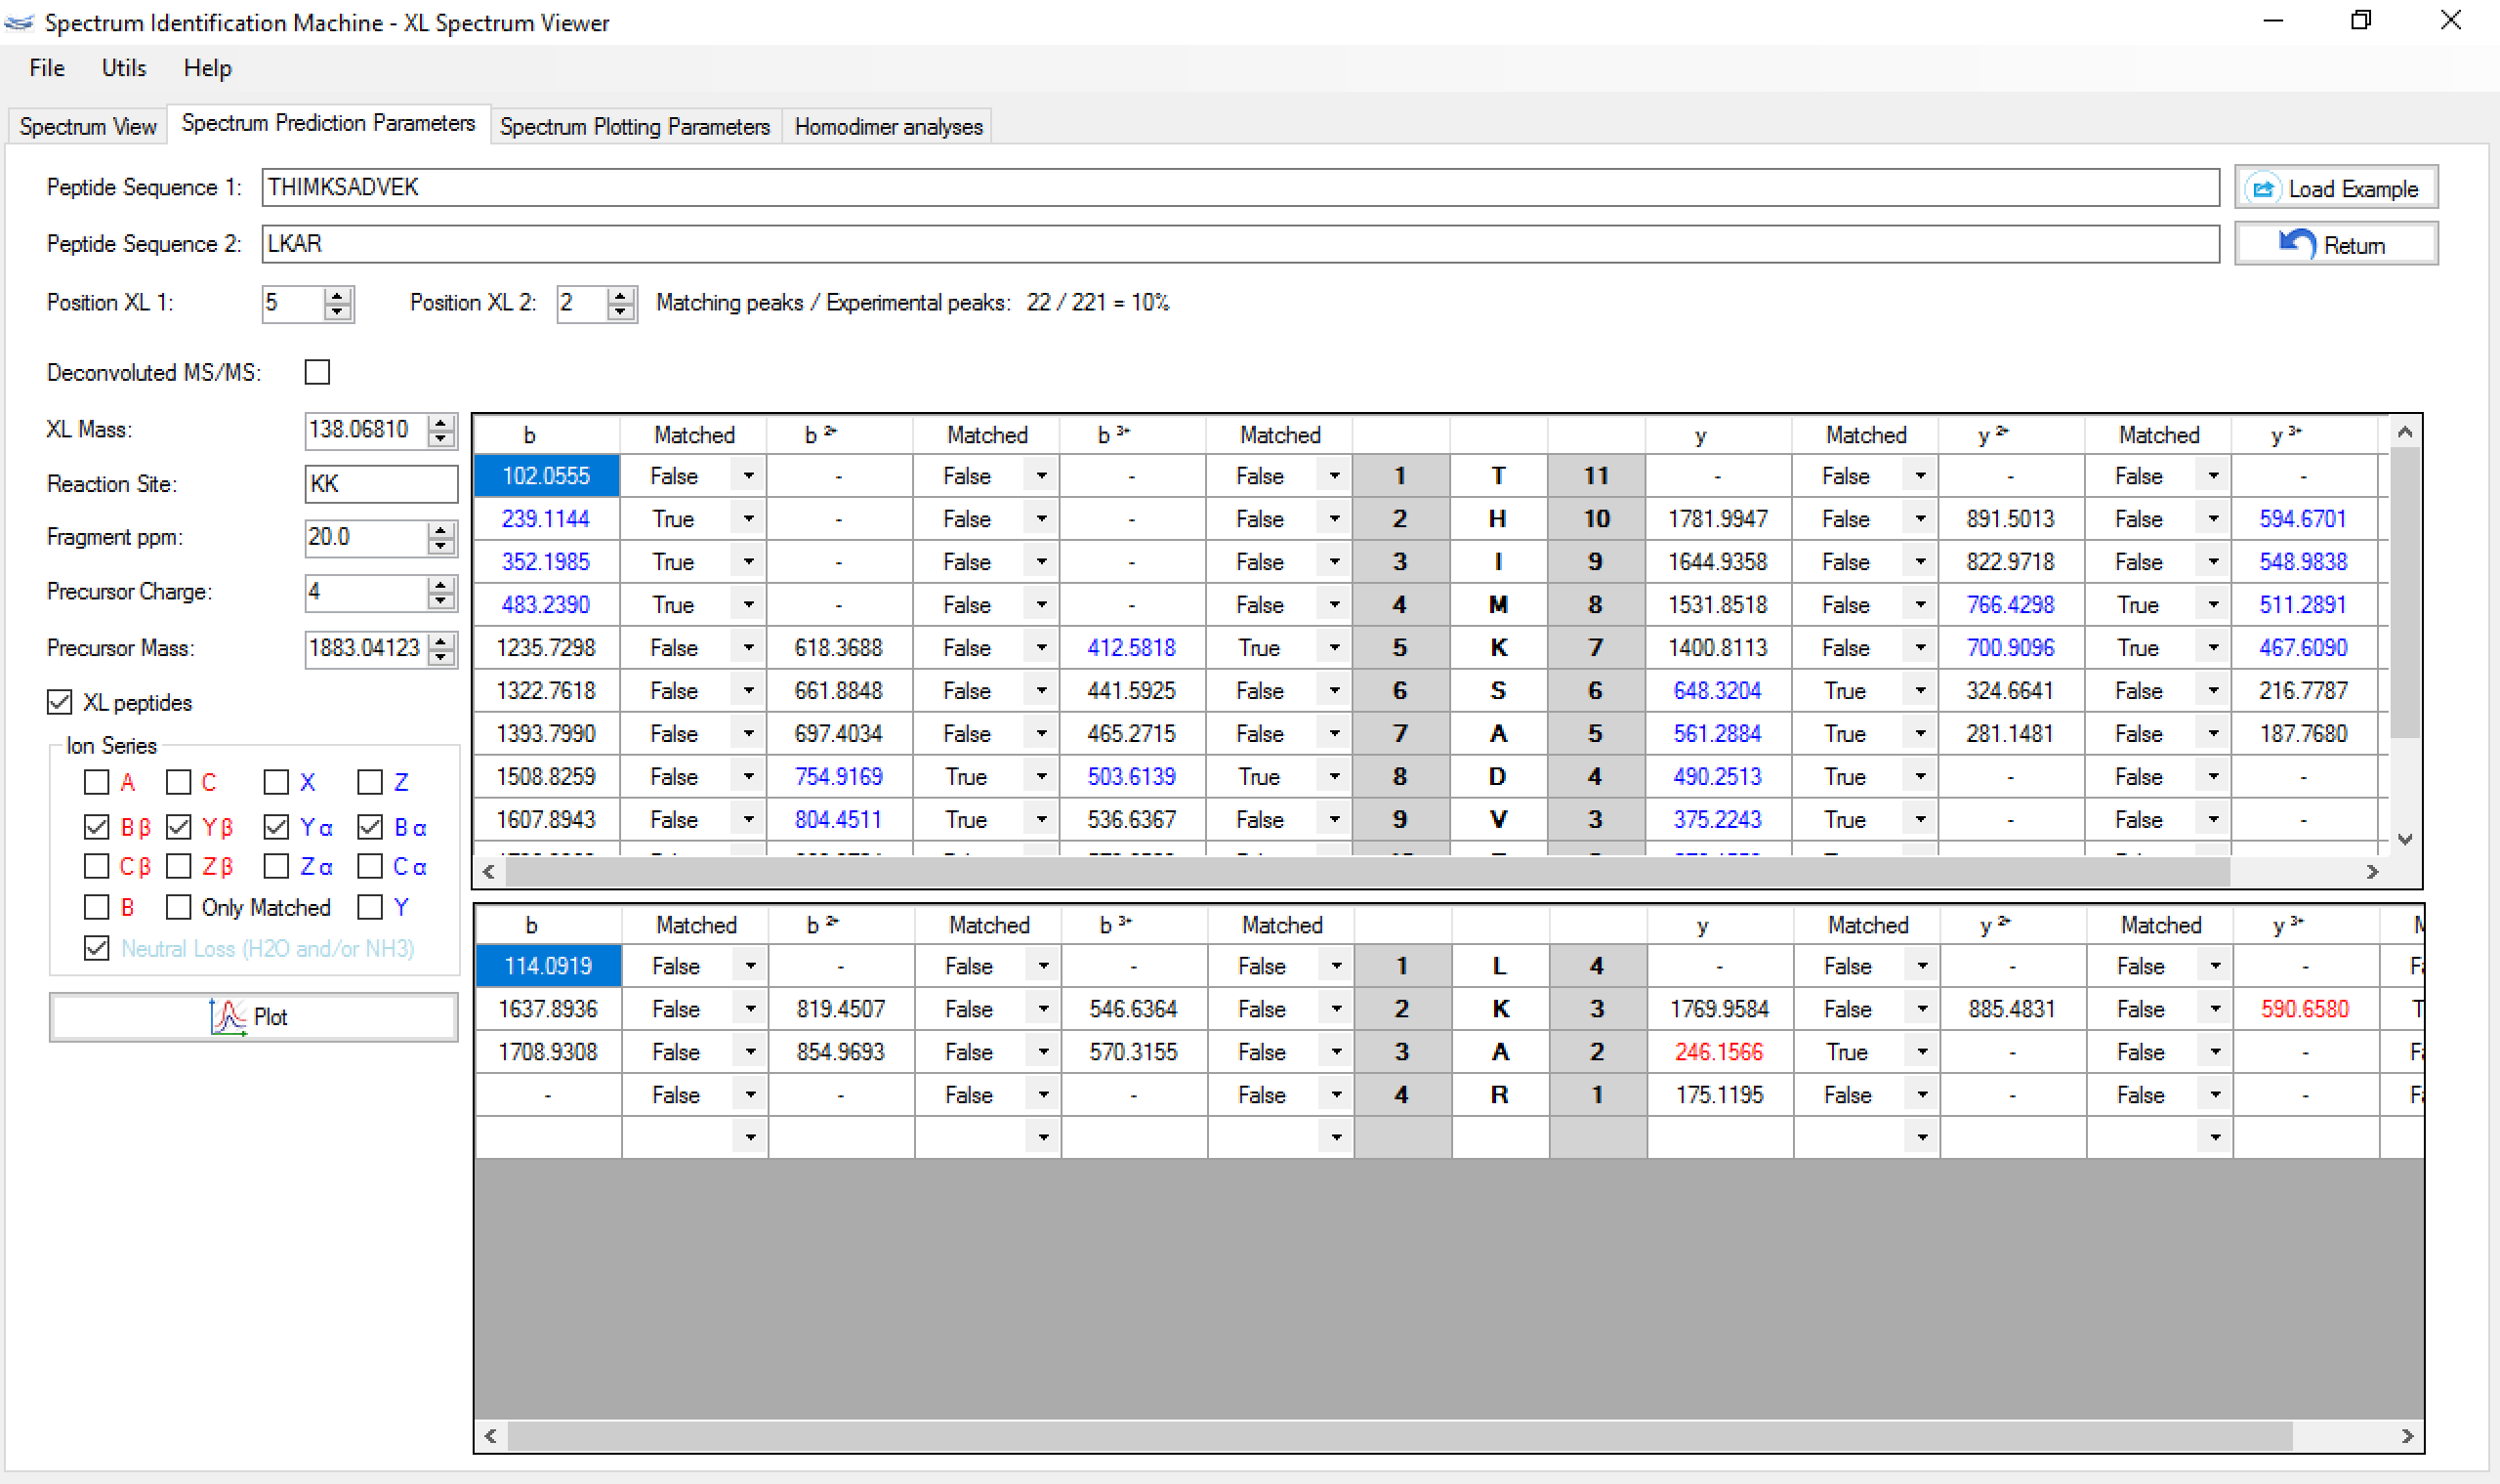 Figure 7
Figure 5 shows a screenshot of SIM-XL's spectrum viewer displaying an annotated XL mass spectrum. The Spectrum View tab allows the user to browse the spectrum, zoom in and out, as well as easily view which peaks were attributed to which series. A ppm deviation plot is available above the annotated mass spectrum. The Peptide Annotation tab gives the user access to the image shown in Figure 6, which facilitates the assessment of the fragments that were identified. Finally, the Spectrum Prediction Parameters tab (Figure 7) provides a table pinpointing the peaks from the experimental mass spectrum that matched those from the theoretically generated one according to the options available on the left. Changes in these parameters also cause the plots of Panel A to update accordingly. These features allow the user to verify, for example, the effects of changing the cross-linker position or even, say, to evaluate the impact on the score of an oxidized methionine or a completely changed sequence of matched peptides. The Spectrum Plotting Parameters tab (also in Figure 7) allows the user to modify the experimental mass-spectral peaks.
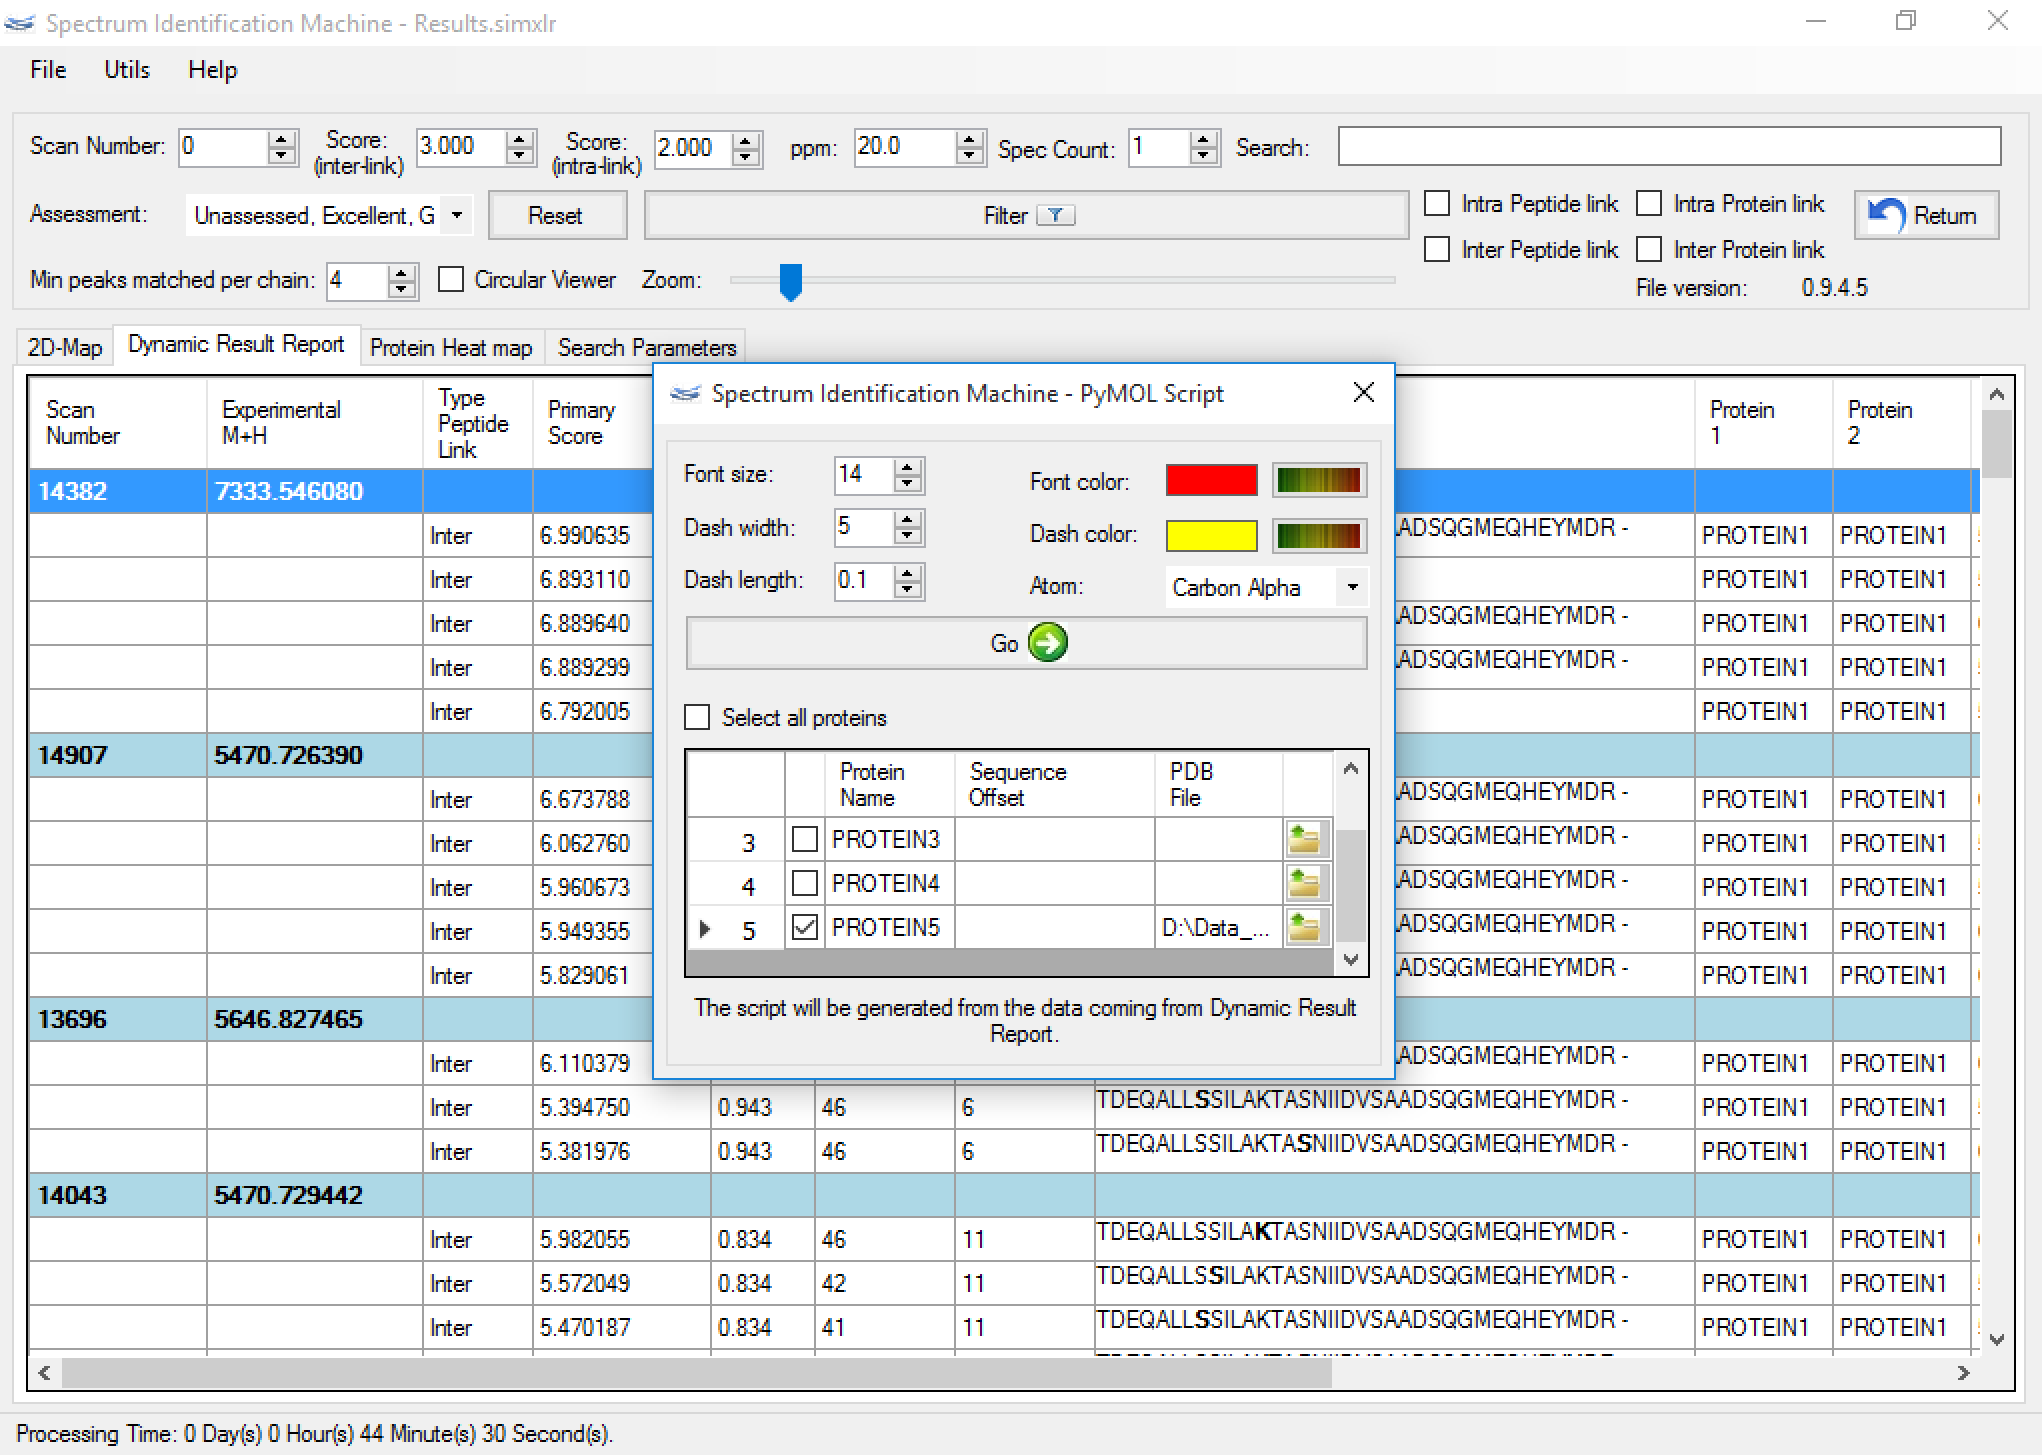
Figure 8
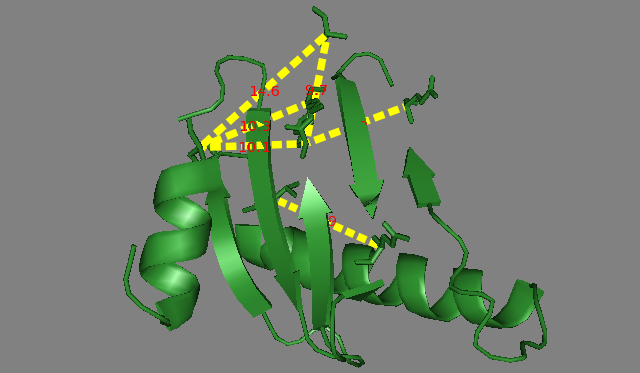
Figure 9
SIM-XL also enables to export a PyMOL script (Figure 8) from spatial constraints obtained from dynamic result report (Figure 3). These data can be used for obtaining important structural information, such as the folding of each protein (Figure 9), the topology of the protein complex and the protein-protein interactions map.
A quantitation is also possible to be performed by our software. As you can see in Figure 10, a XIC curve is calculated by the algorithm to show how efficient is the linkage.
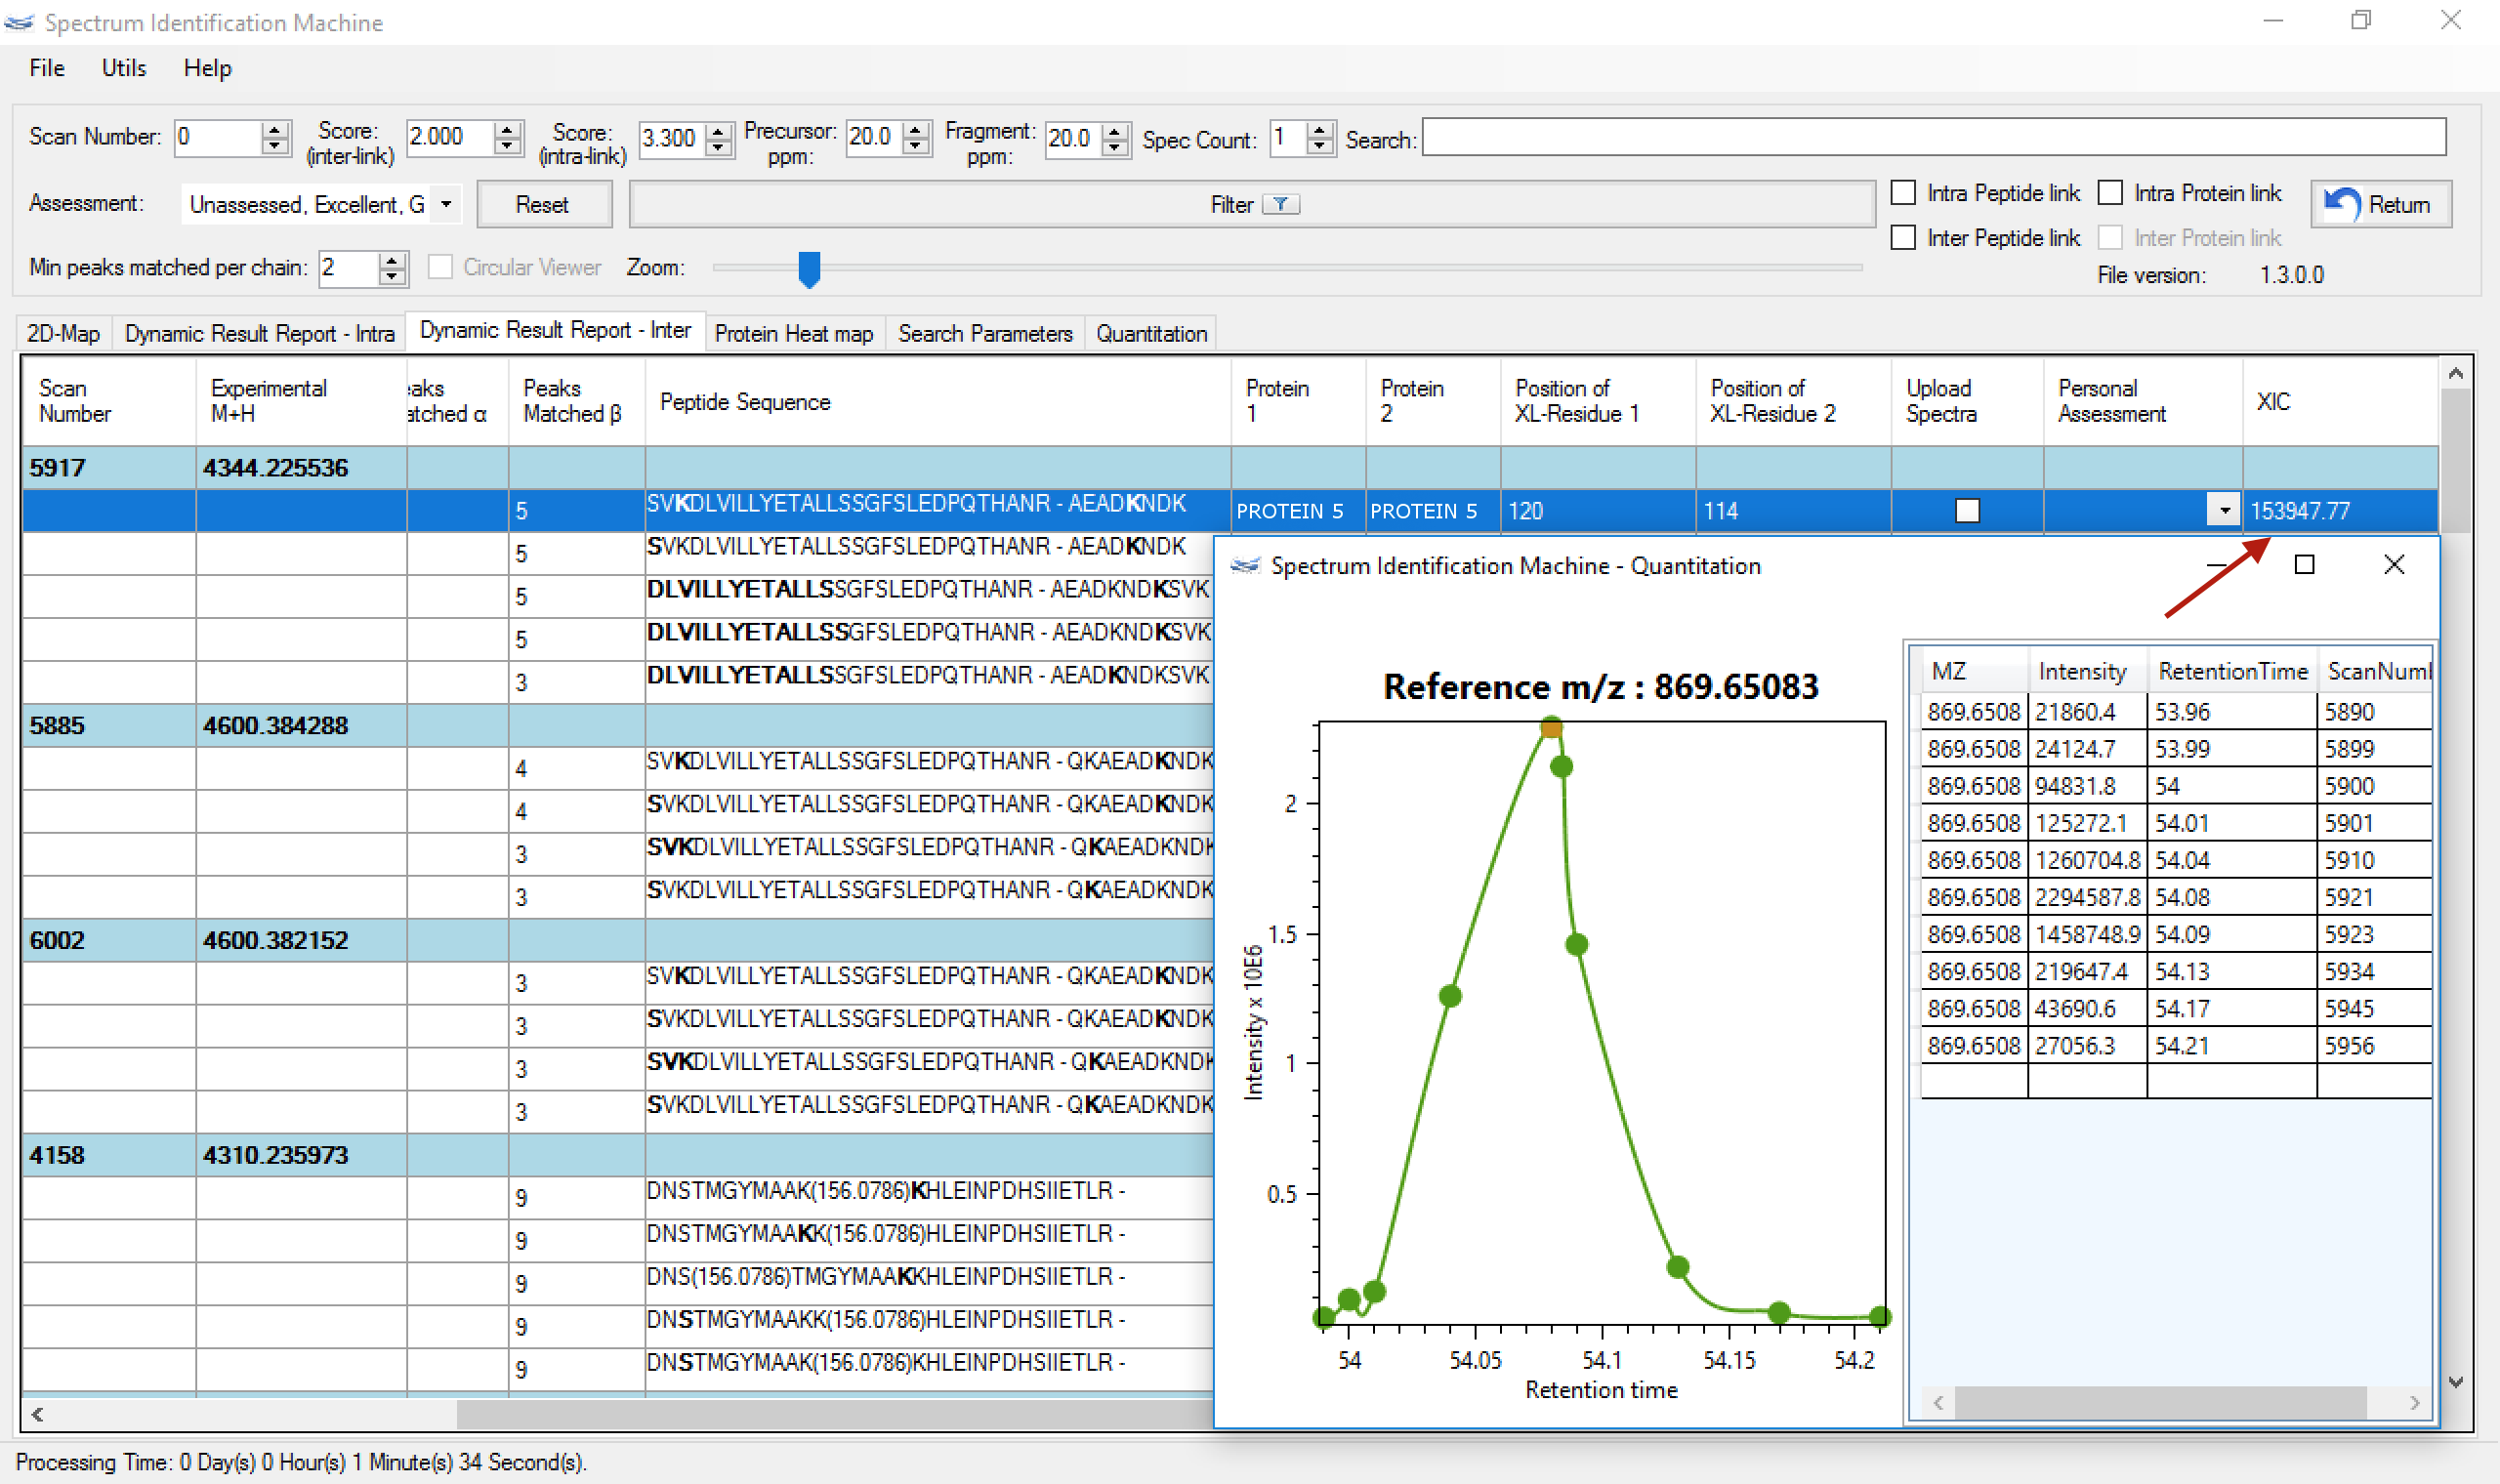 Figure 10
Figure 11 shows a screenshot of SIM-XL's 2D map showing the Protein Domain. This feature allows the user to customize the color and the region of a specific protein. The importance of this protein domain is to understand which part of the protein domain there are more interactions among the same or different proteins.
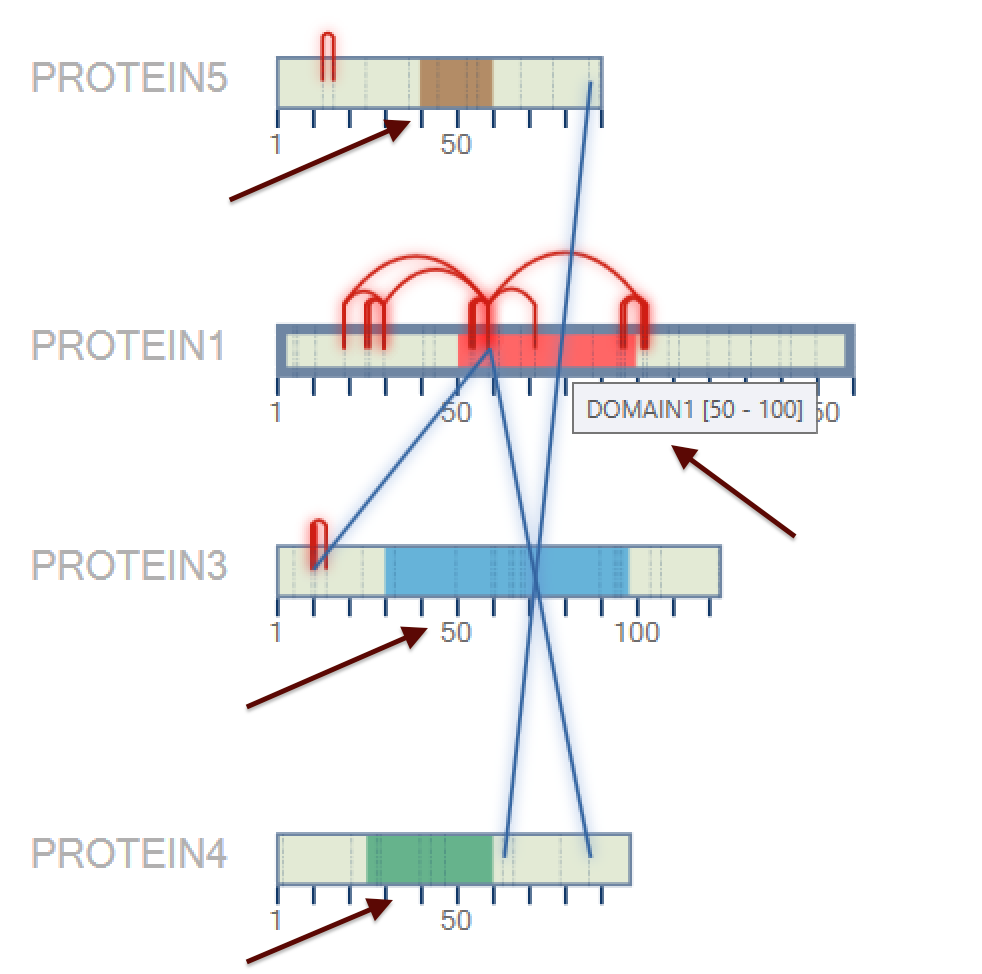 Figure 11